
Manhattan has been through a long-duration, low-volume down cycle that began in late spring 2022 as the Fed started hiking rates. Looking back at the last twenty months, sellers only got a notable uptick in demand in March and May 2023. And even then, volume levels were only slightly higher than seasonal averages. Other than that, it's been an exhausting period of low activity for sellers in what could only be described as a challenging listing climate. For any buyers sitting on the fence, waiting for an entry point, consider this:
1. Prices Are Down by Roughly 10% Since April Peak
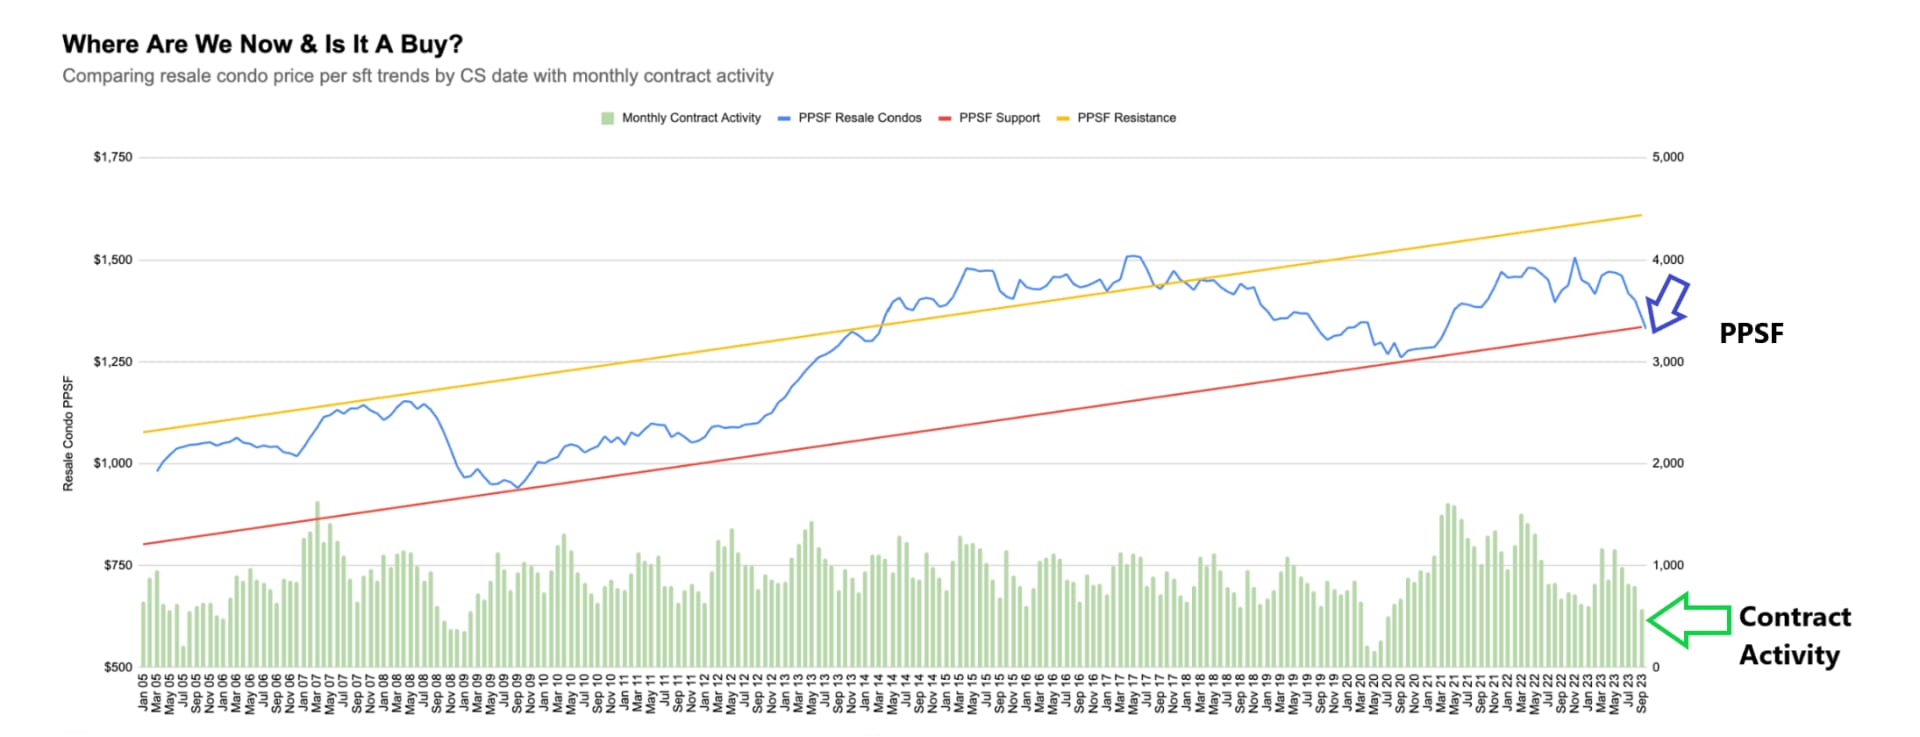
The chart below shows price-per-square-foot trends for the Manhattan resale condo market; a preferred measure of broad market price action. By looking at the contract signed date vs the closing date, we can bridge the gap of lagging sales data and give a more real-time look at where the market is today.
The Bottom Line: Prices are already down and likely slightly lower in today's active marketplace, given the lagging nature of closed sales trends. With a seasonal uptick anticipated, today’s window of buy-side leverage may prove to be an excellent entry point for buyers.
2. Liquidity is Low
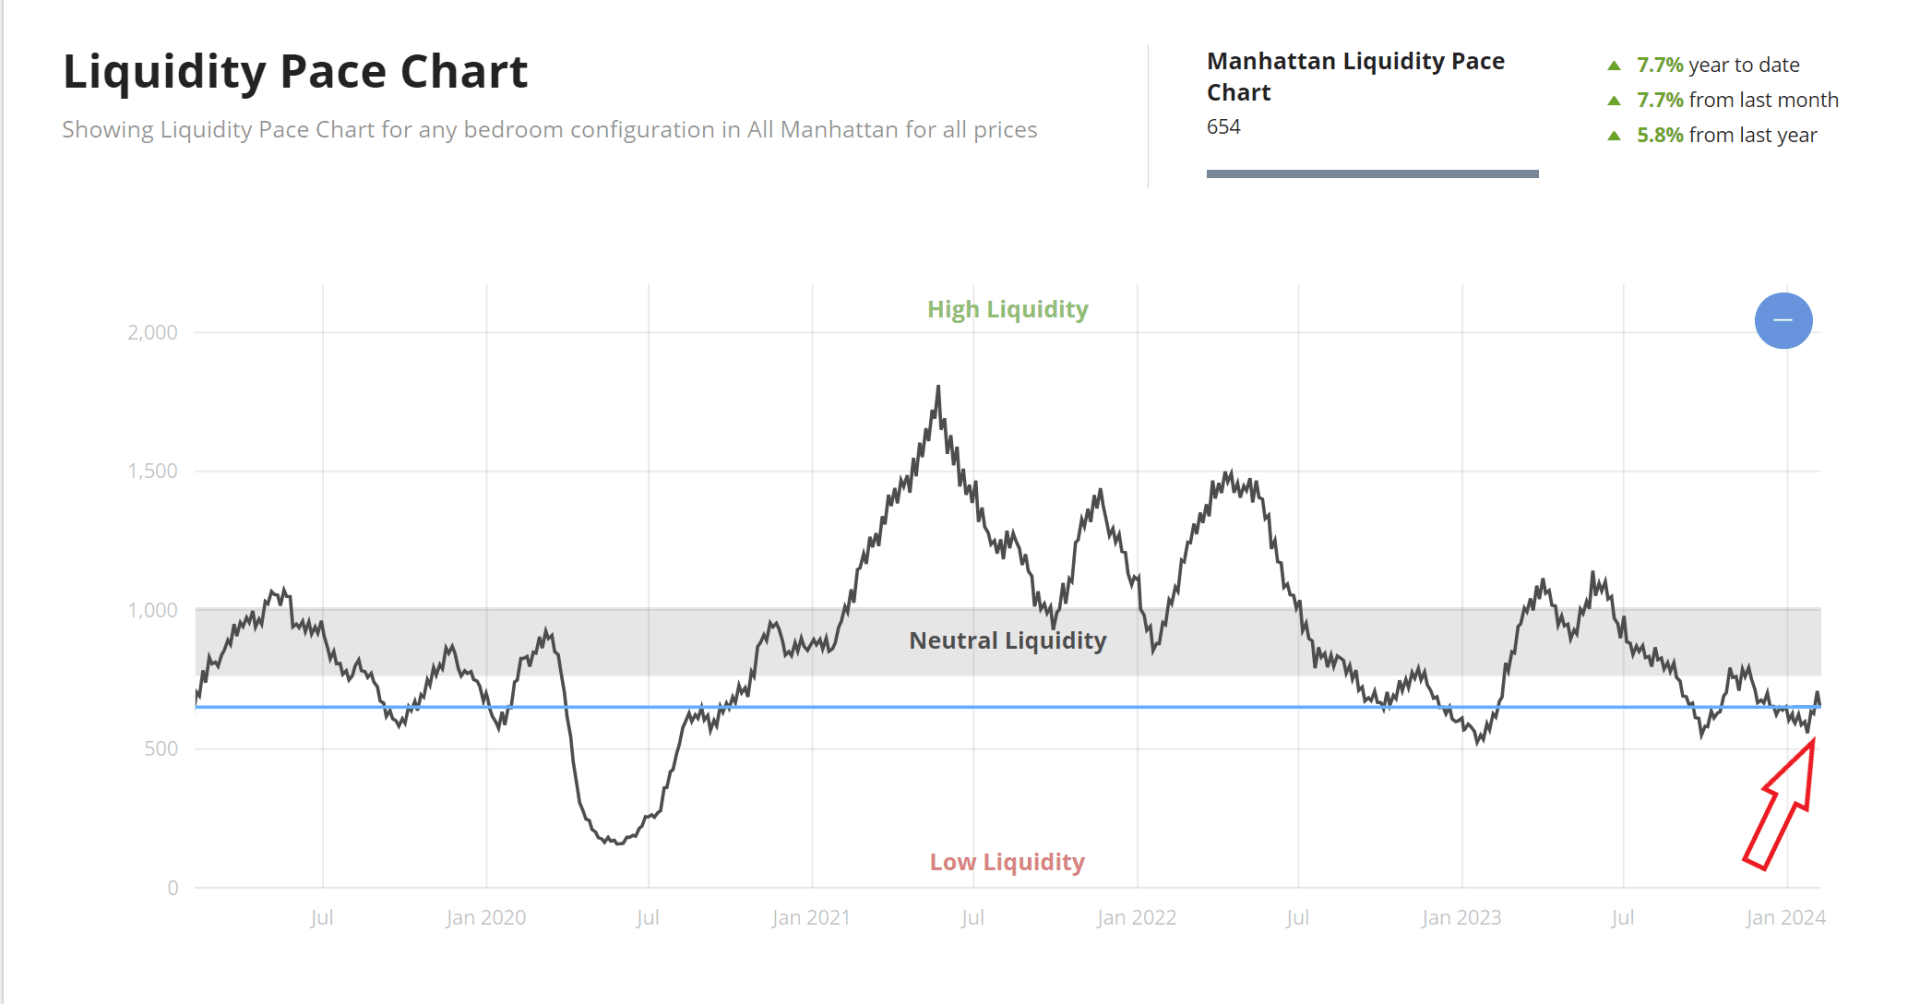
This 30-day moving window of contracts signed tells us whether today’s market is active or slow. This indicator will fall in slow markets and represent a more challenging market environment for sellers. As bid-ask spreads widen, transaction activity falls, and discounts rise due to low liquidity. While fewer buyers are stepping up, those who do purchase in low-liquidity markets tend to look back favorably versus buying in highly liquid, active
markets where fewer discounts and leverage are being offered.
The Bottom Line: We are near three-year lows for our liquidity measure of demand. Considering the long duration of progressively lower deal volume, it’s safe to say that market leverage is favored to the buy side.
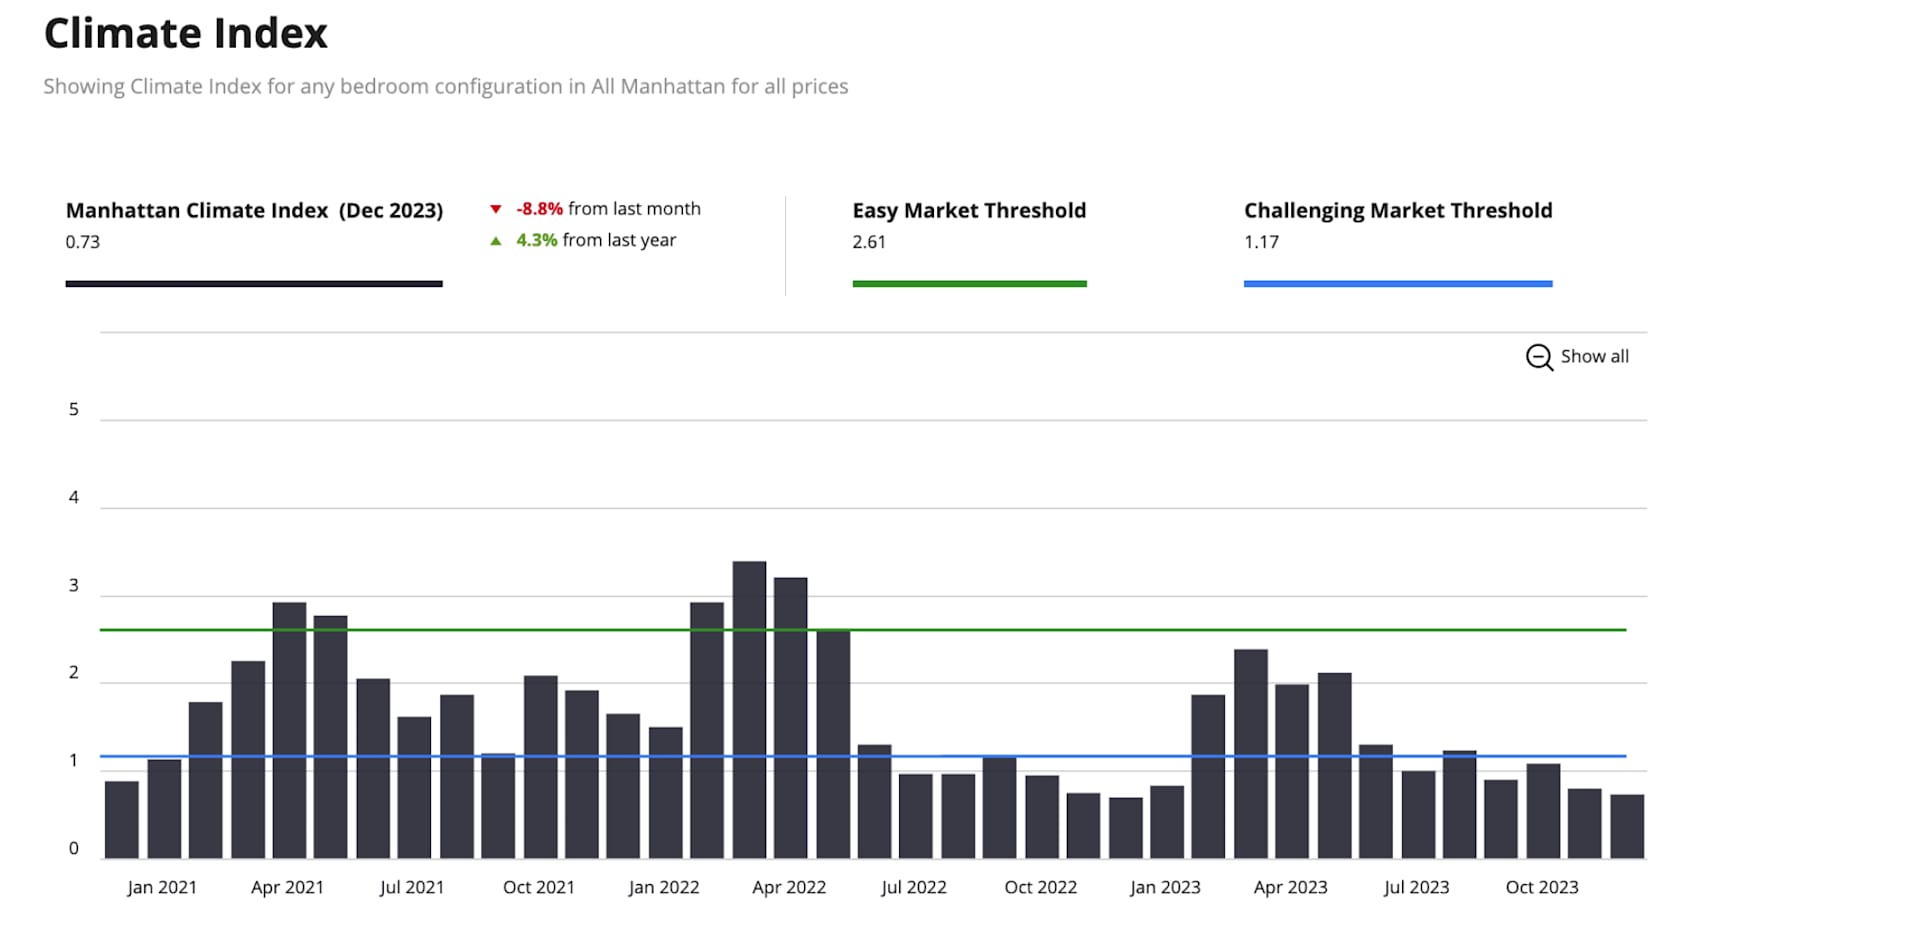
3. The Sell-Side Listing Climate is Challenging
The listing climate index is derived by looking at the success or failure trends of active listings on the market today. If more listings are successful and going into contract versus off the market, the index will rise and represent an easier listing climate for sellers. However, this is not and has not been the case. As the chart shows, the index has been in progressive decline since spring 2023, as more listings have been going off-market and
failing to find a buyer versus going into contract.
The Bottom Line: It is a tough environment for sellers, and it’s been this way for the majority of the last 19 months. Flip that around, and you have a moment in time that offers an opportunity for willing and able buyers.
4. It’s Been a Long Duration Buyer’s Market
Due to constrained supply and low new listing trends, the market pulse is still only slightly in buyer’s market territory. That is the one element of the markets today that is outside buyers' favor. Otherwise, this metric would be much lower. Nevertheless, for the most part, it has been a buyer’s market since the summer of 2022.
The Bottom Line: With tight supply and the coming spring active season, we can expect upward pressure on this indicator in the months to come as buy-side leverage fades closer to the neutral line. First, we need to get through a wave of new listing activity, and then, if demand picks up with any speed, this metric could move higher and represent fading negotiability and price advantages that buyers today enjoy.

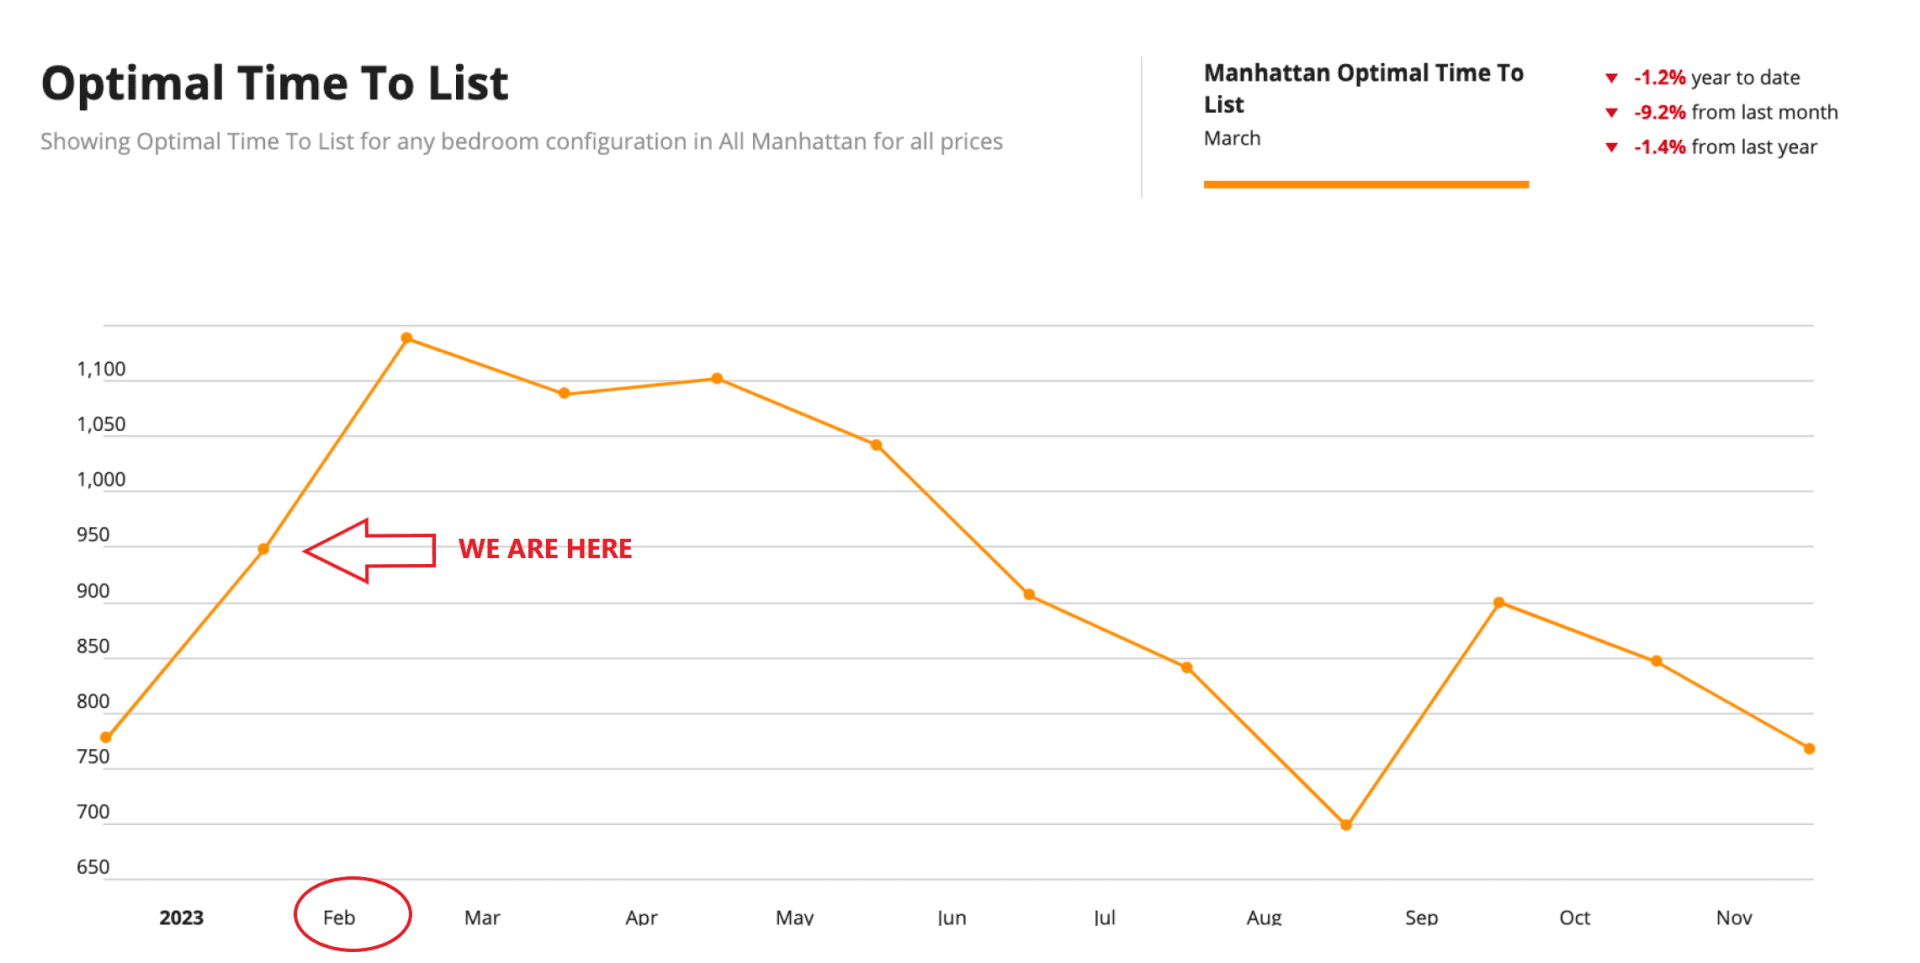
5. Expect Seasonal Activity to Rise Starting in February
This chart shows the long-term average number of contracts signed each month. Seasonality is clearly on display. Historically, our three slowest months are September, December, and January. This is important to note in combination with lower price action and contract activity trends because we are about to enter the four strongest months of activity in the spring and early summer.
The Bottom Line: Buyers should expect the long-duration downturn in deal volume to reverse course and move higher as we get into February and March. Considering where we have been and where we are now, the leverage window for buyers should remain open for another few weeks and then will likely fade as activity picks up.
Advice for Buyers:
This is your moment in time. The combination of low activity, lower prices, more negotiability, and a challenging listing environment presents a current and unique market opportunity. While supply is tight, we are weeks away from the spring listing season, which will offer both new options and put additional pressure on existing unsold inventory, which could ultimately lead to value plays. Buyers must be aware that sellers on the market for fewer than 30 days are less likely to hit a low-ball bid.
Value seekers should target listings 180+ days on the market with multiple price reductions. Using our advanced search tools, we can see many active listings that fit these criteria as of this research note. Focus on the unchangeables: raw space, views, private outdoor space, and location, and take advantage of those properties that may be selling at a low price due to the need for improvements. While inflationary trends seem to be peaking, the penalty the market is currently putting on unrenovated properties may start to fade.