
Watch this content HERE.
It’s September, and with it, some seasonal winds of change for Manhattan’s real estate market. August was slower, as expected, and so was the first half of September, a relatively quiet time in NYC’s real estate market. What’s ahead? Keep reading.
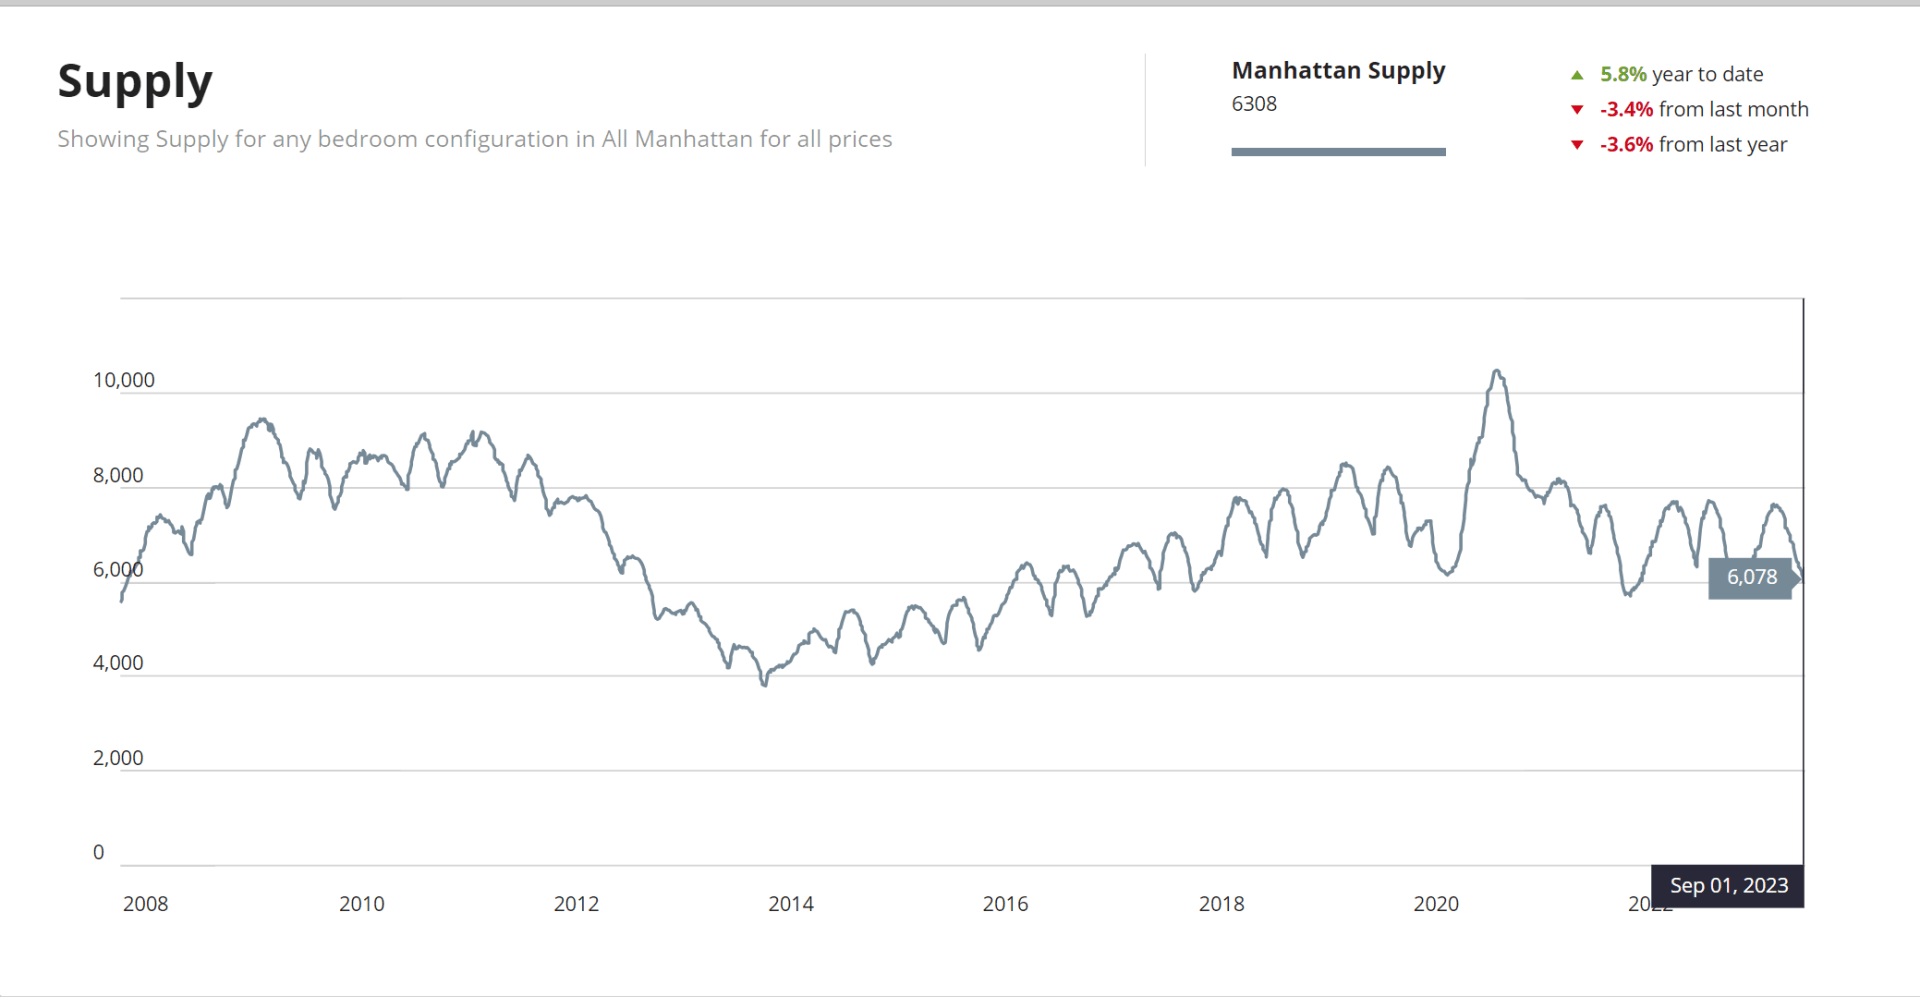
Supply continued to drop this August to the low six thousand, a 3.5% or so drop both from last month and last year.
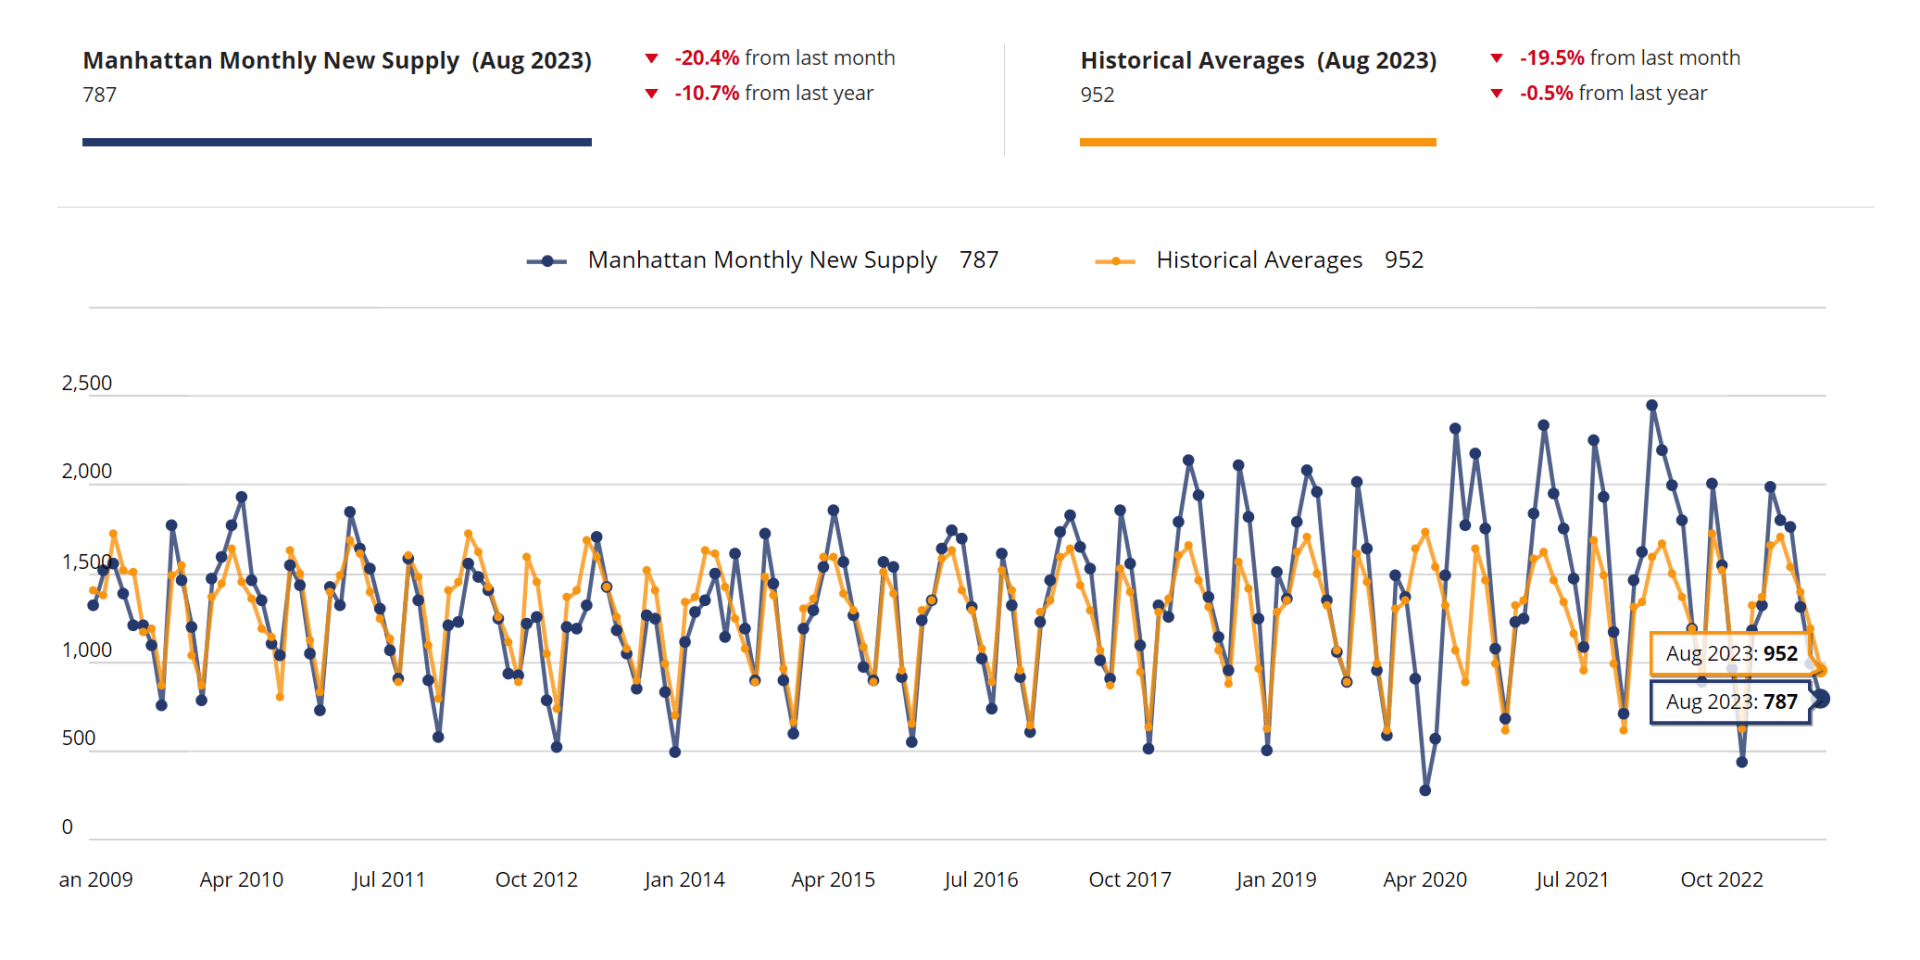
787 new listings came to market in August, a 19.5% decline from the previous month. This decrease in available inventory has also affected activity, with monthly contract activity falling by 7% from July.
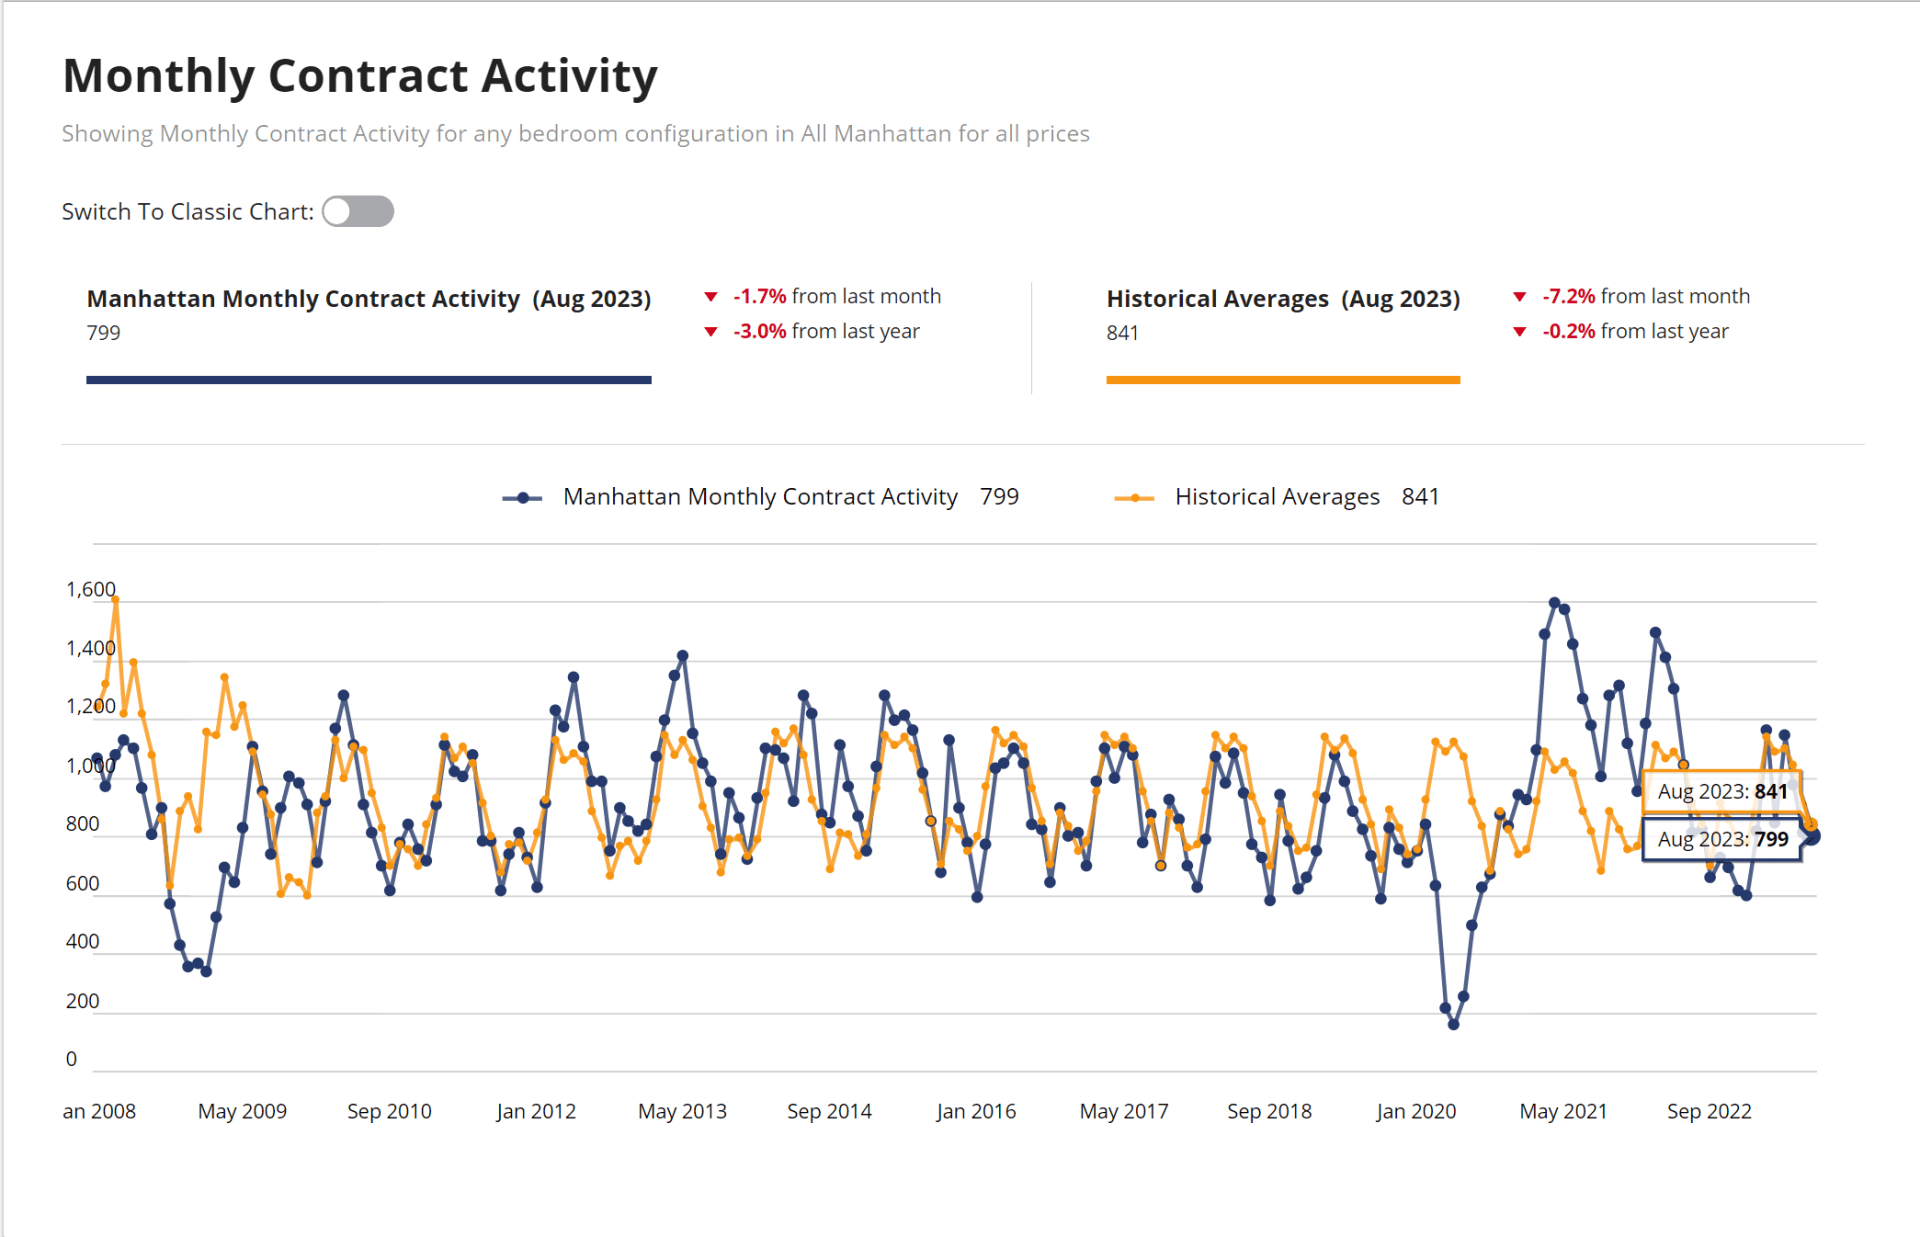
We do expect supply to rise in the next week or so, as sellers return from their summers away and a new listing wave hits the market. The number of signed contracts is also expected to rise in October, as a result of some new business being done over the busier fall season.
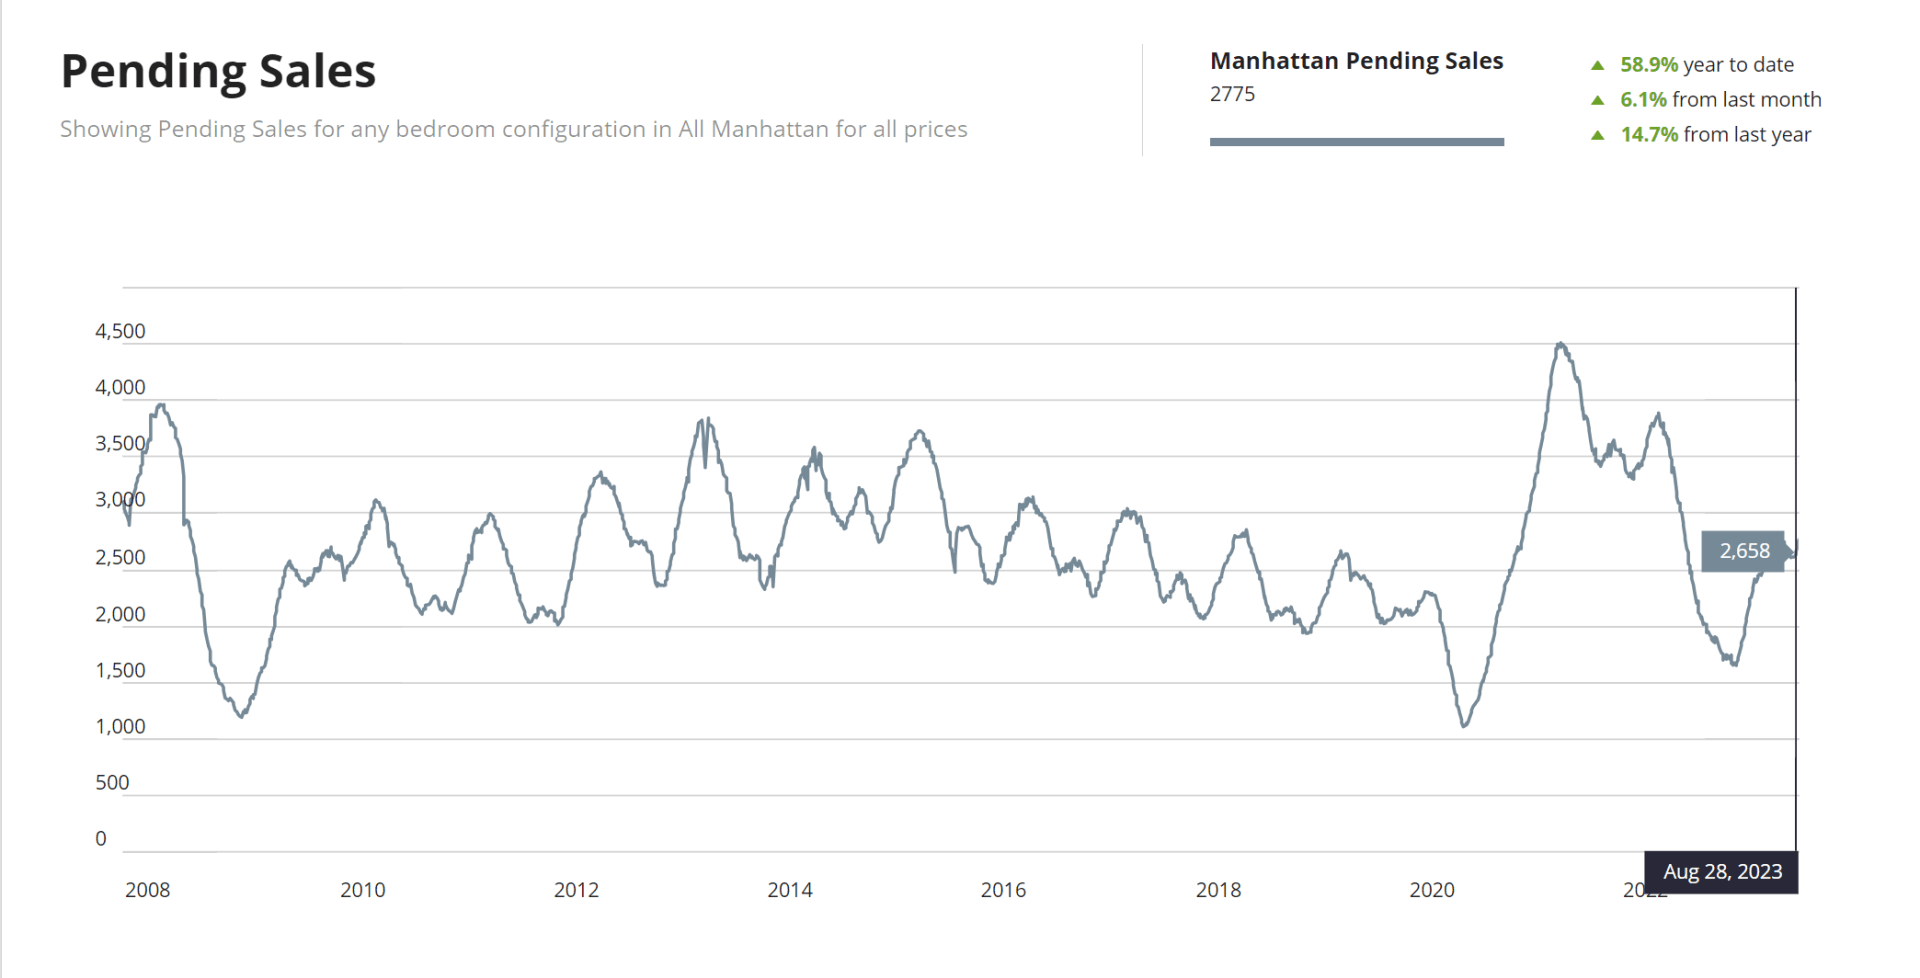
Pending sales are up by close to 60% year to date, and by 6% from last month, to 2,775. We expect this number to start declining significantly over the next 2-3 weeks as deals continue to close. When supply drops it puts pressure on the market pulse, making it rise.
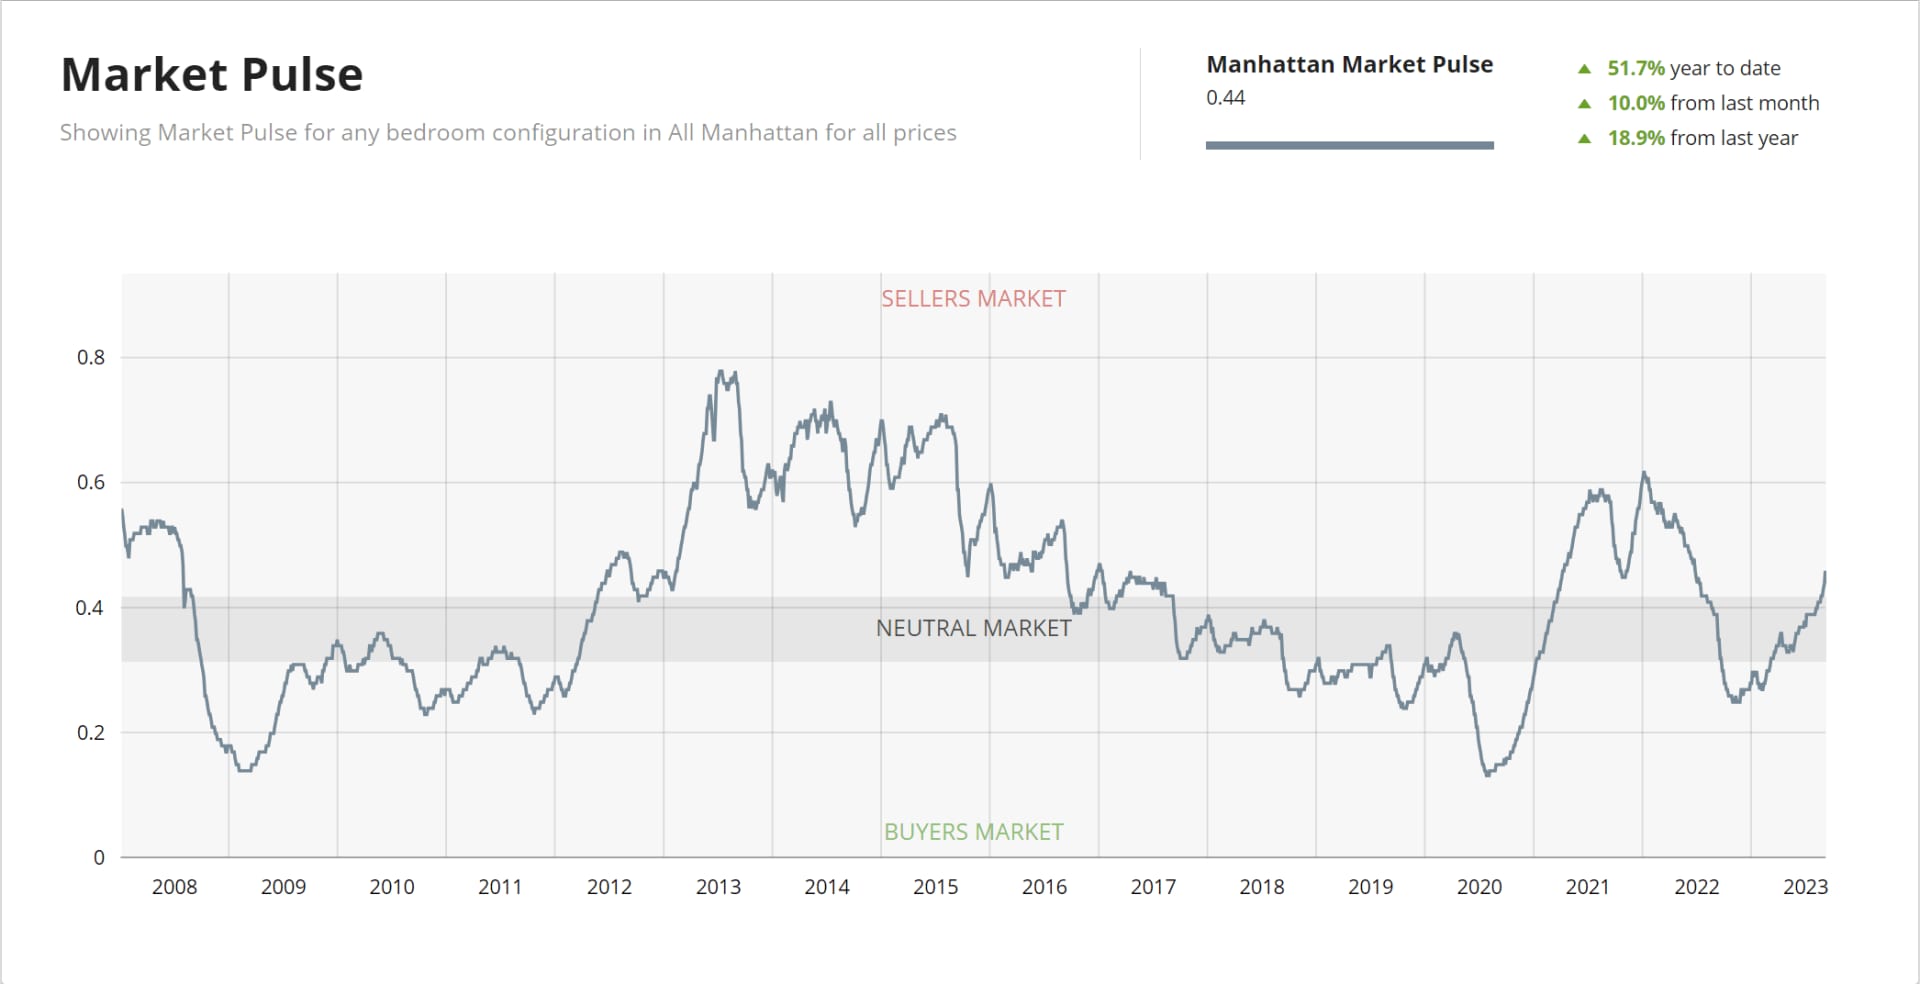
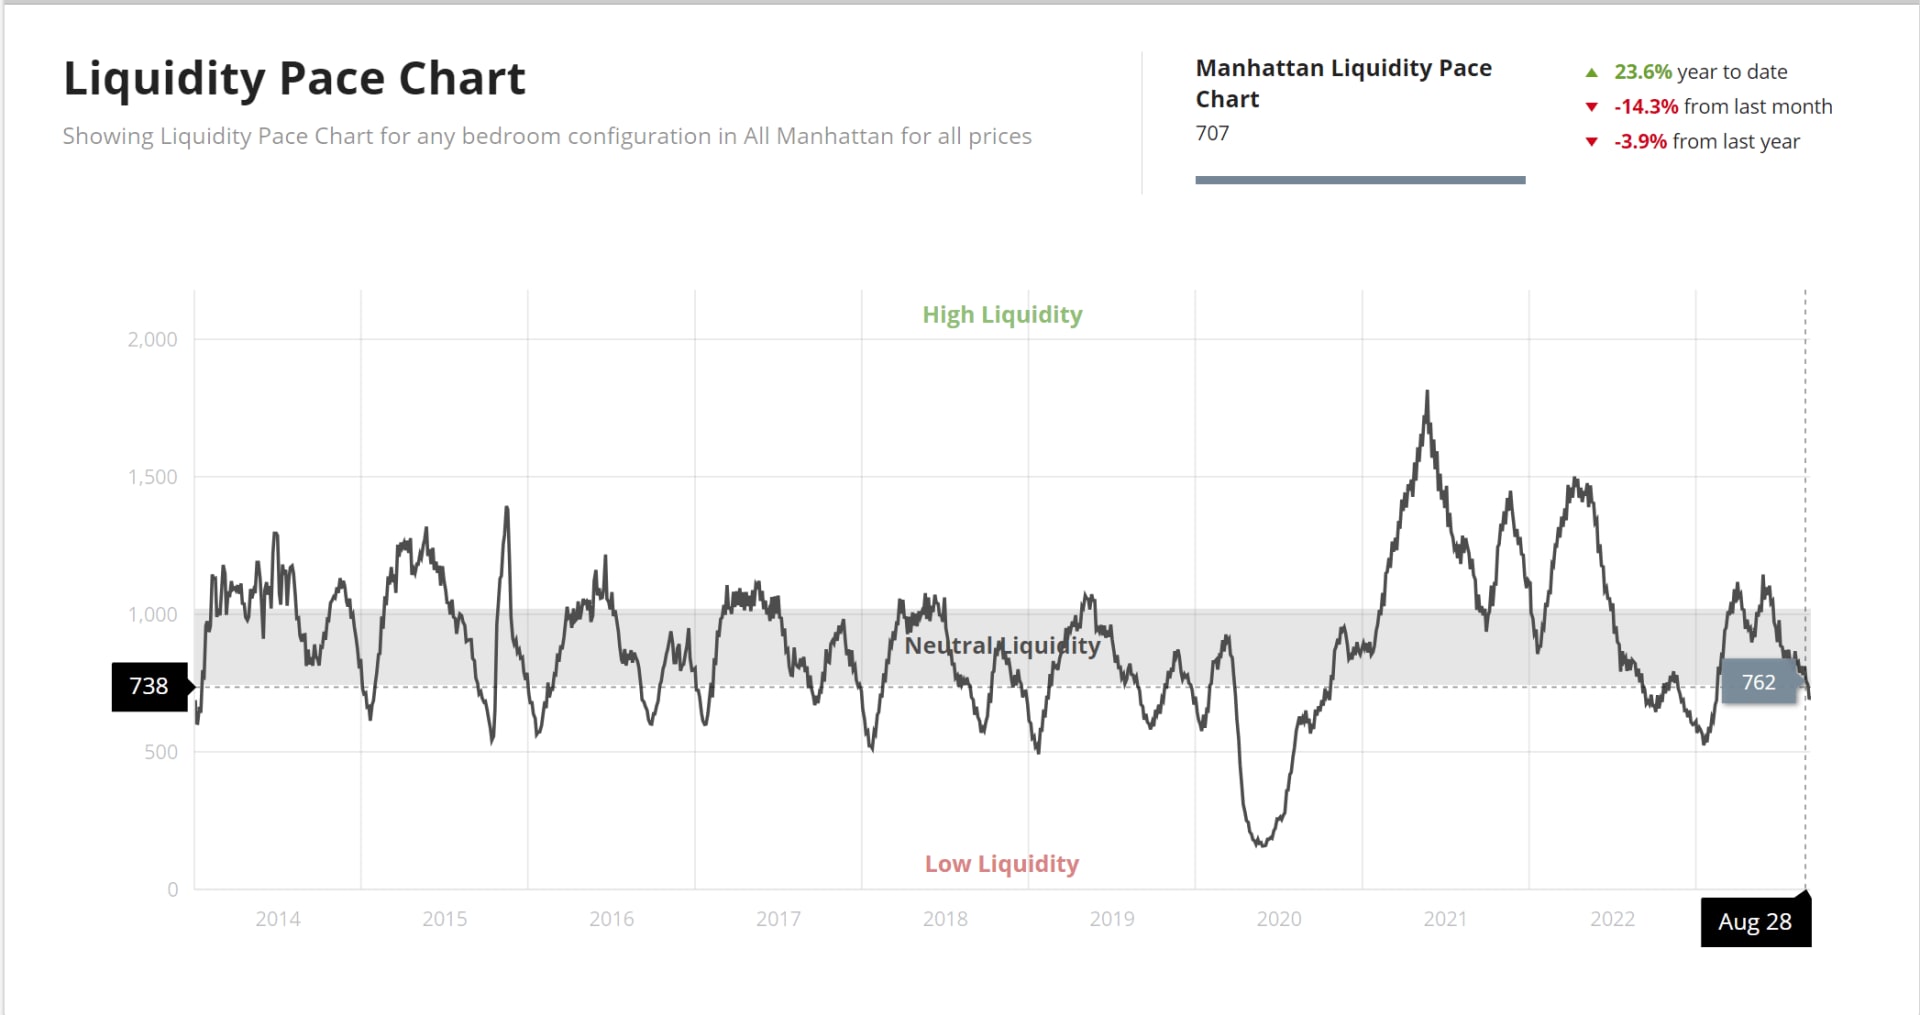
It is worth remembering, however, that both the pending sales and market pulse are in a 6-month window, not the most current data. Market Pulse is at 0.44 with a 10% increase from last month, reflecting those pending sales that are not out yet. UrbanDigs launched a new metric called liquid pace, that uses liquidity as a more up-to-date measure. When we look at it now, the market pulse remains in the middle with no significant rise, indicating a more neutral market.
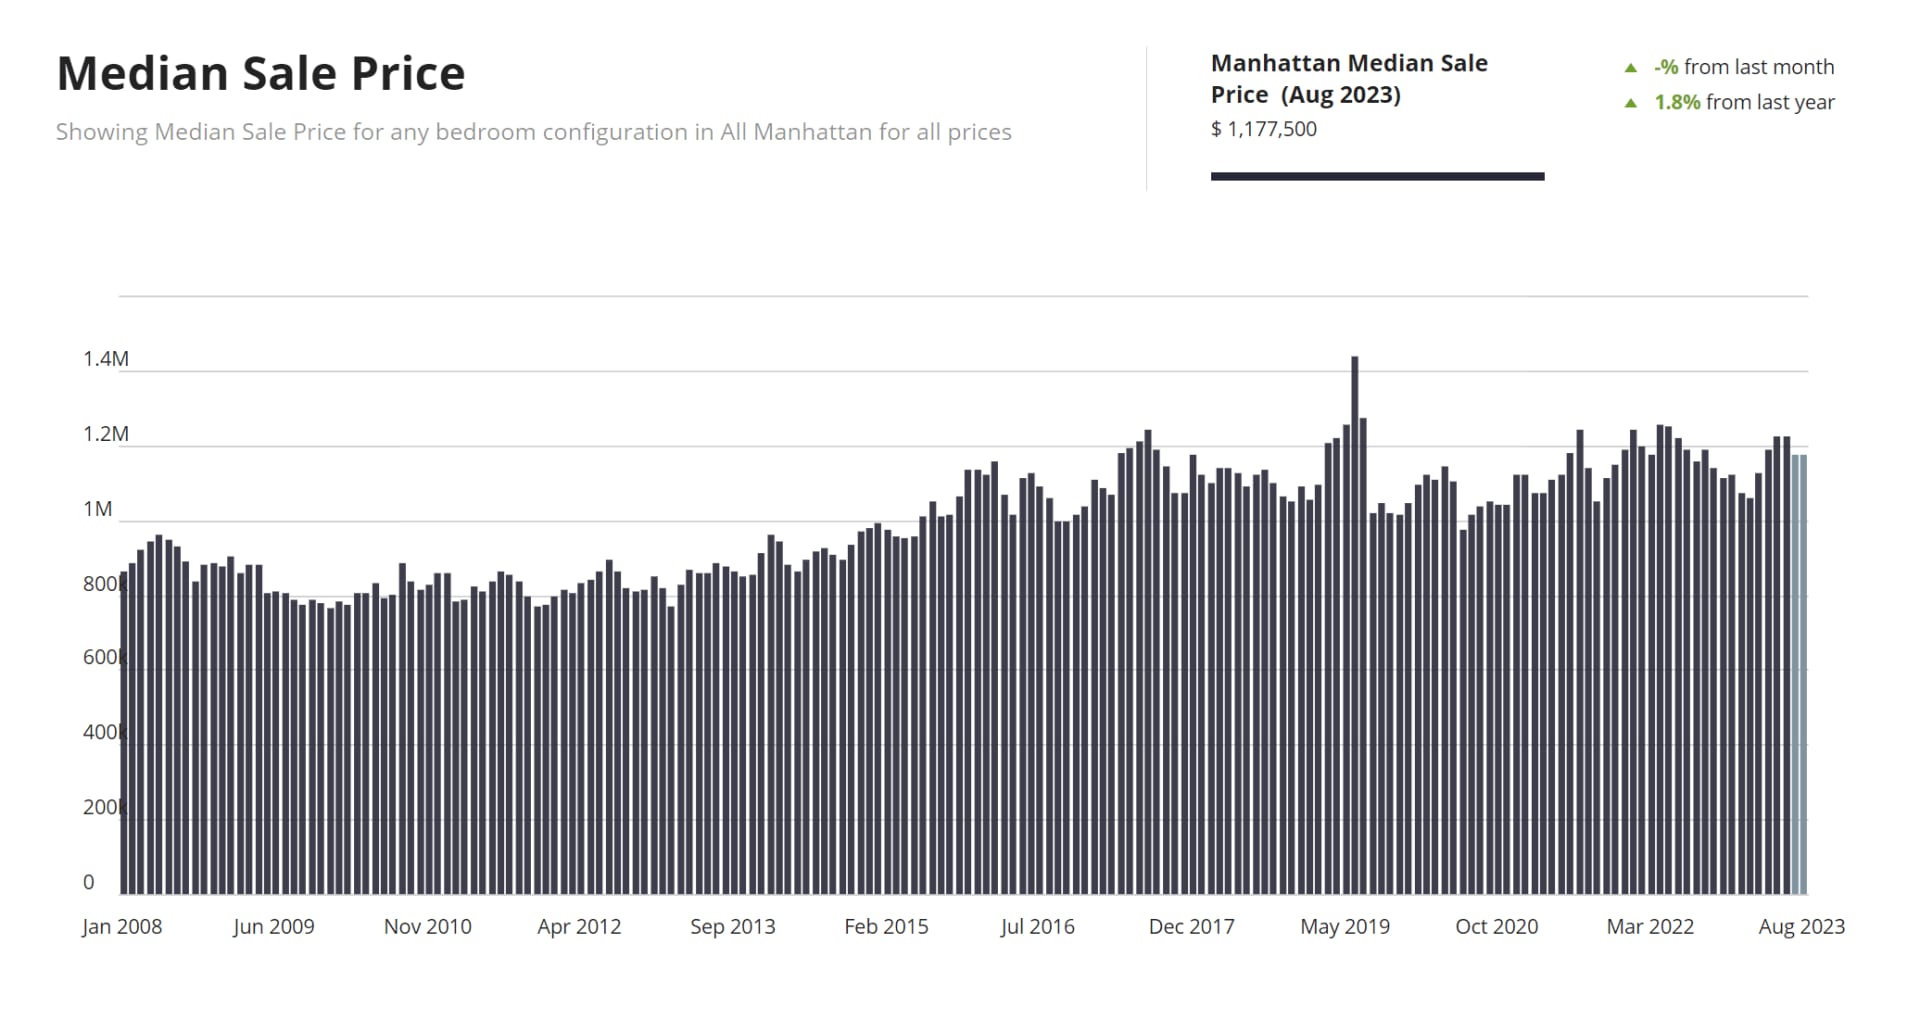
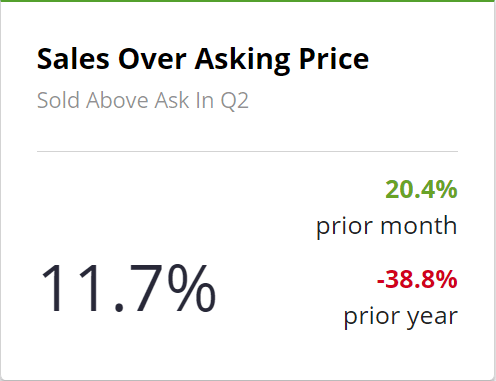
With fewer listings on the market, prices remain high with the median sales price hovering close to one million-two, and more than 20% increase in the monthly number of sales closing above-asking price.
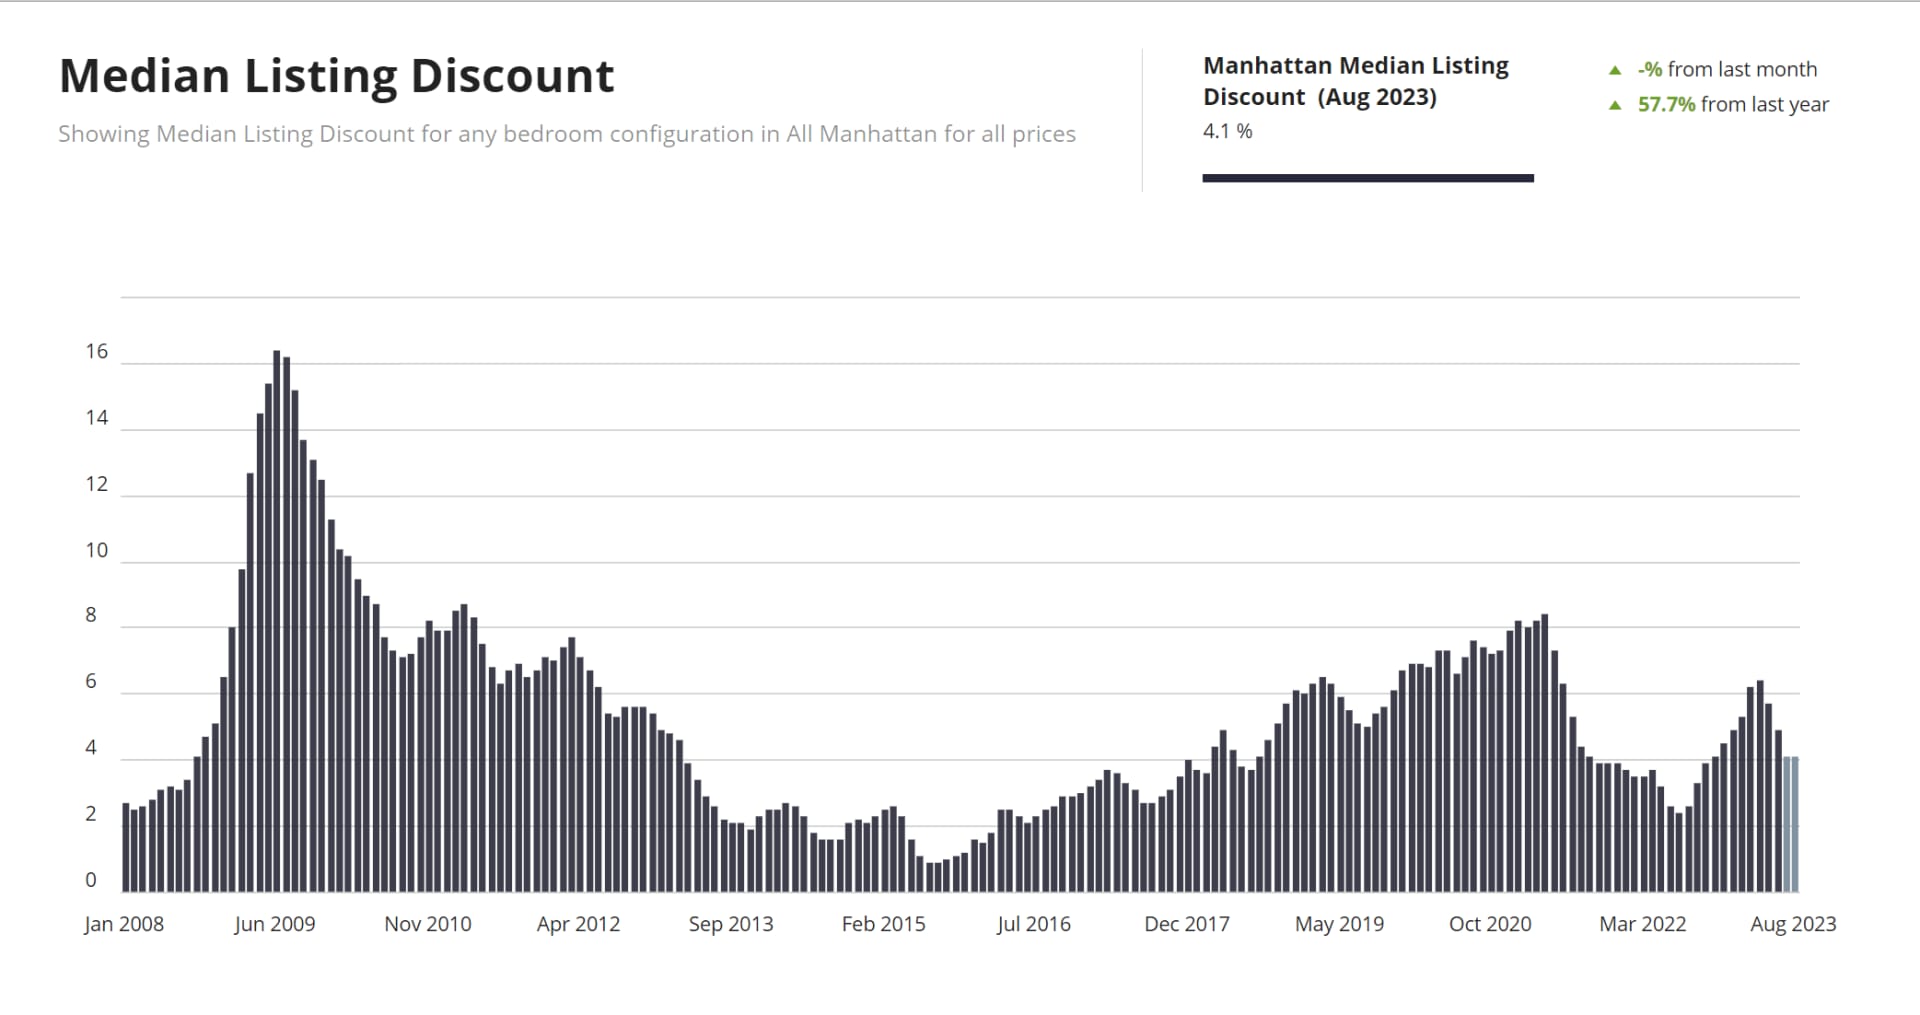
The median discount also remains at 4% with no change from last month. Sellers are locked into their low interest-rates, contributing further to the pressure on inventory and driving the prices up. Supply is not keeping up with demand.
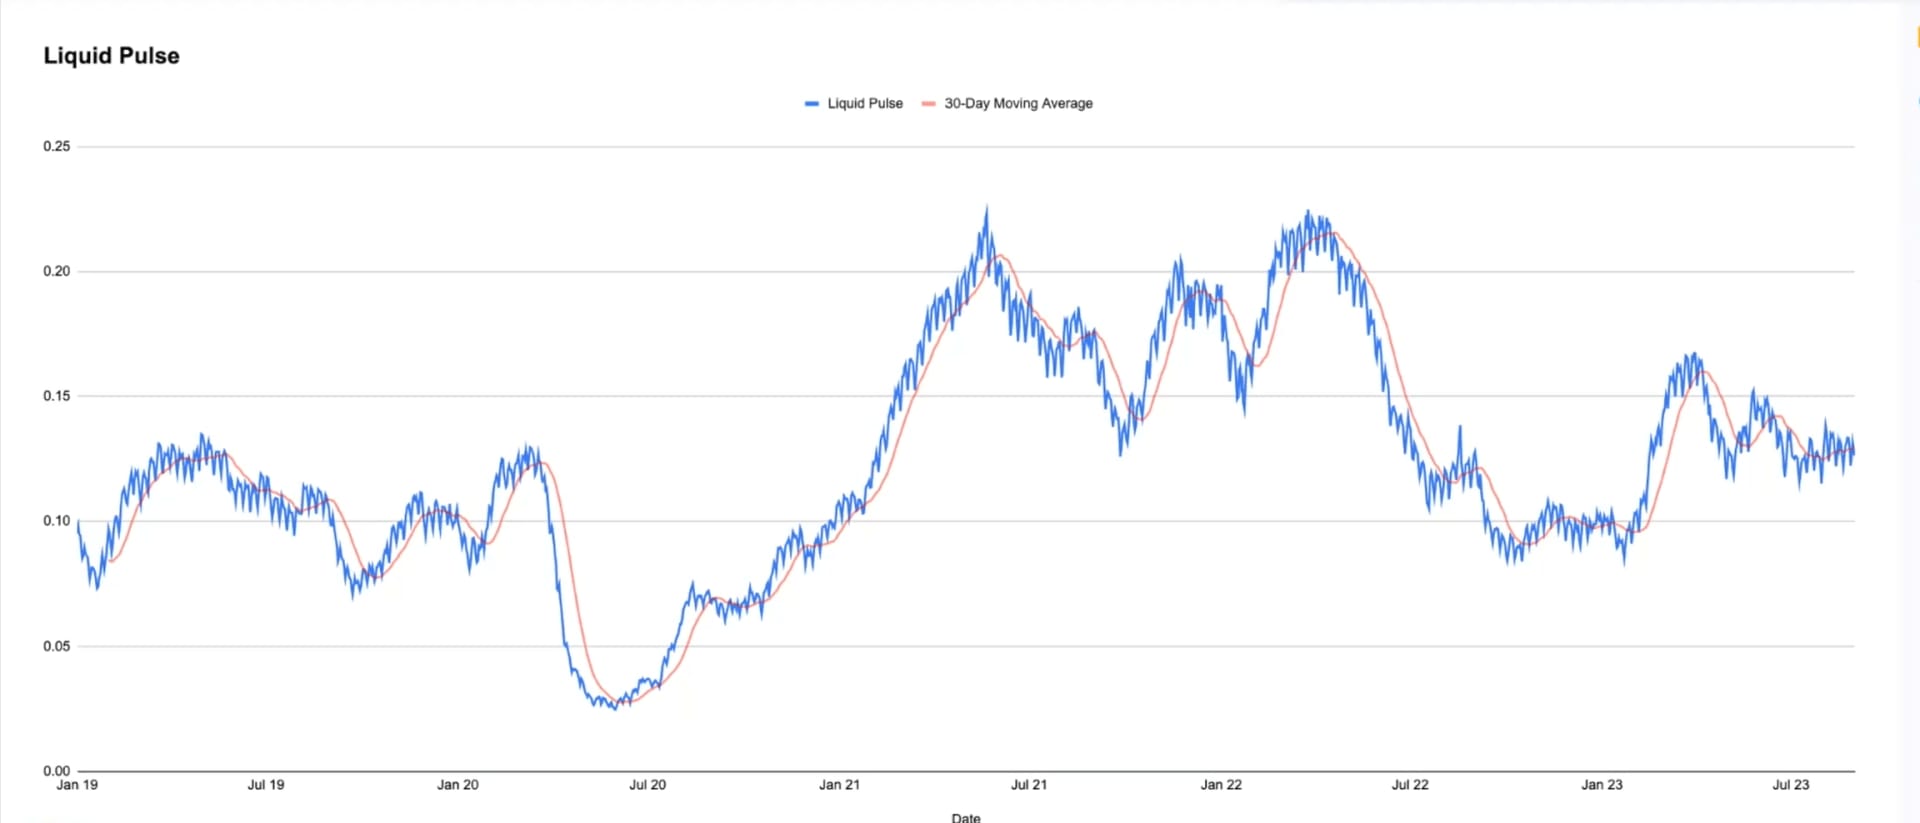
When we look at the pace of liquidity, a 30-day moving window of signed contracts, we also see a decline in demand, and this is expected to last for the next 3 weeks or so.
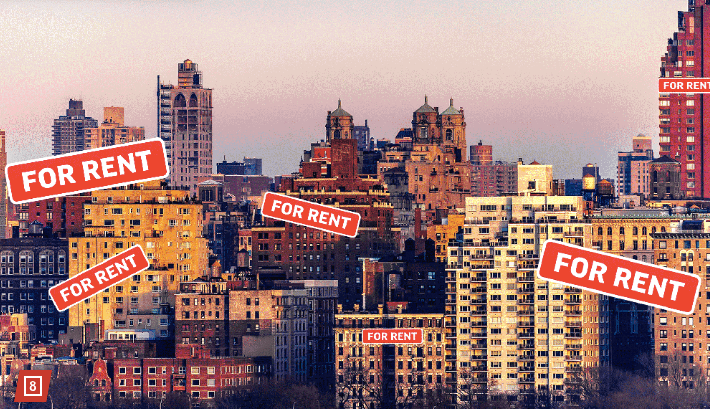
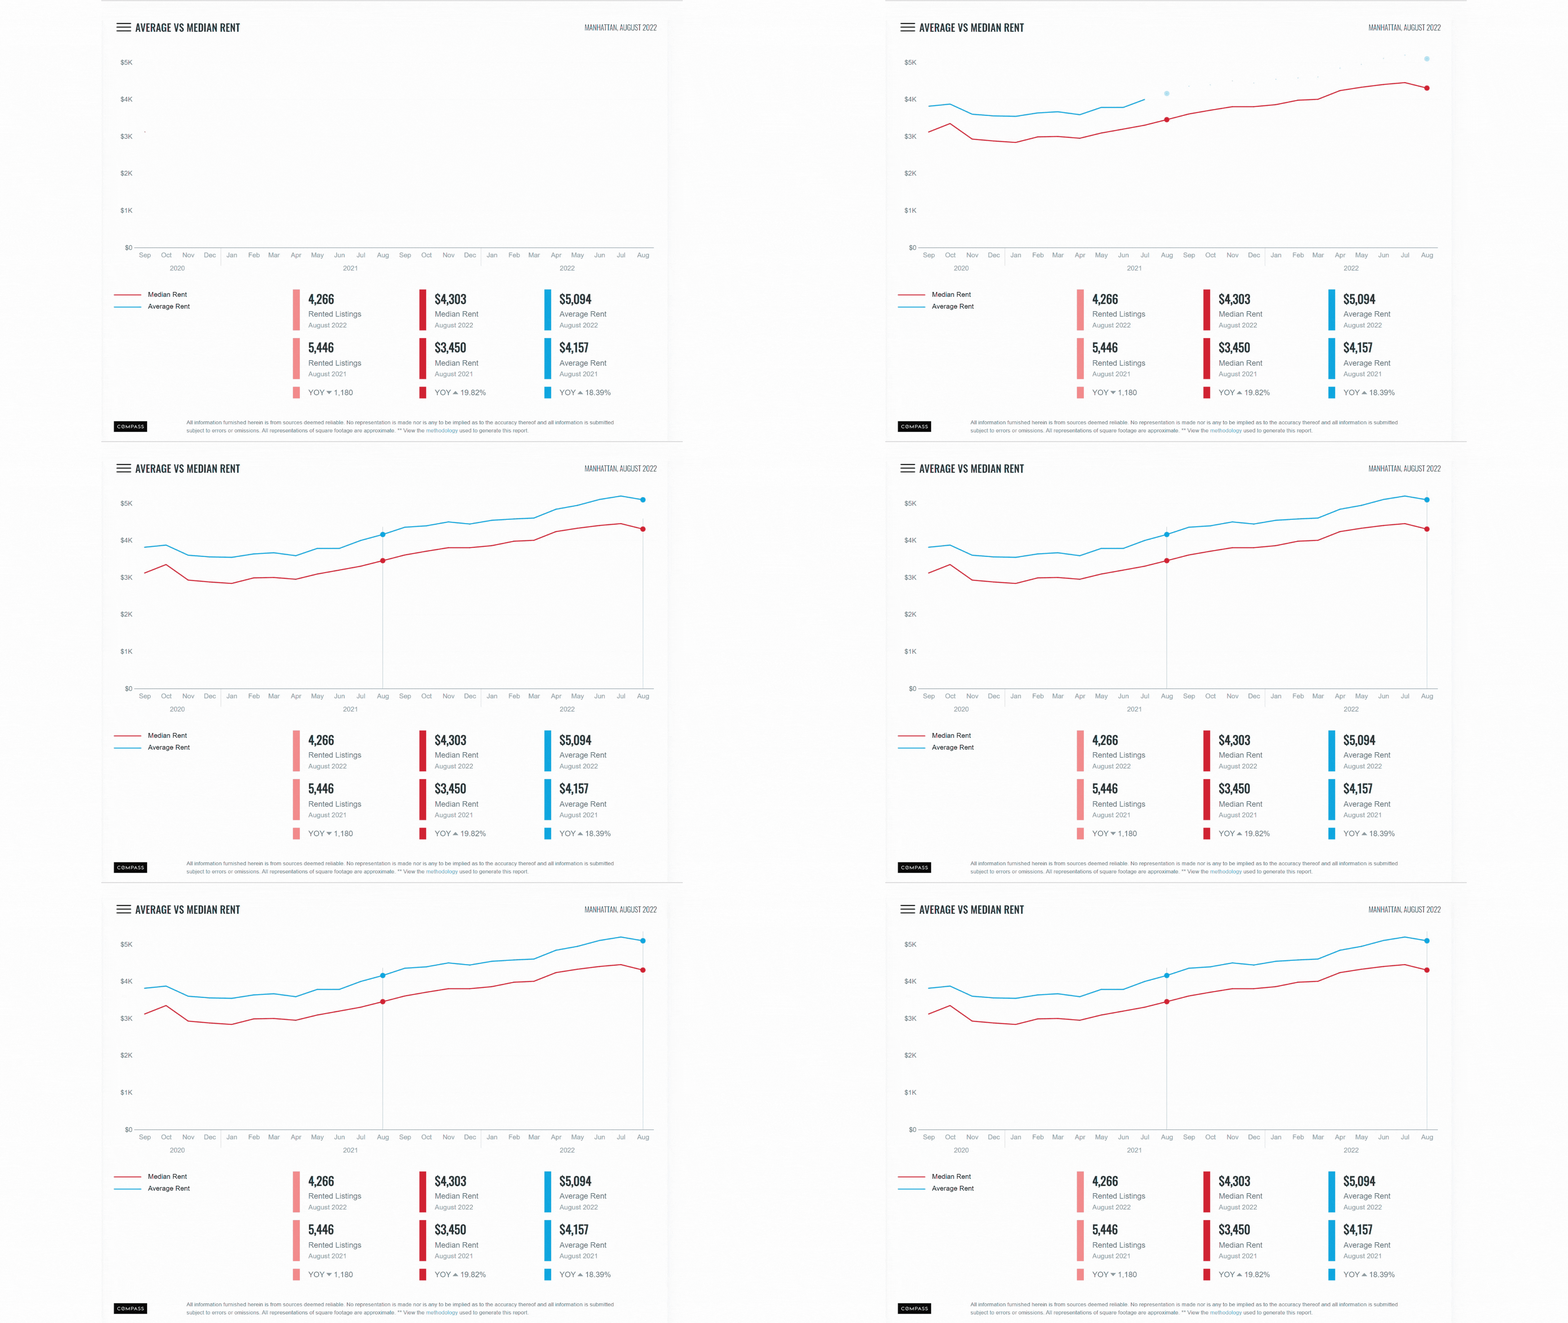
Manhattan’s rental market may be starting to even out. The median rent dropped slightly from last month and is now at $4,303, a 4.2% decrease. With new legislation regarding short-term rentals and rezoning for office-to-residential buildings, we may see more units become available for long-term renters in the upcoming years.
So, what awaits our market?
I predict a rise in available inventory, more activity in the market, and more contracts signed toward October-November. Rents will remain high but will most likely not go higher than they are, and sale prices will not drop by much, as long as sellers continue to hold on to their low rates and refuse to go on the market. Negotiability, as a result, will remain limited. Sellers listing their units will see more activity; the time to transact is NOW.