
Watch this content HERE
The weather may be cooling but hopefully, New York City’s housing market will be warming up! Let’s take a look at what NYC real estate did in September and over the past 3 months.
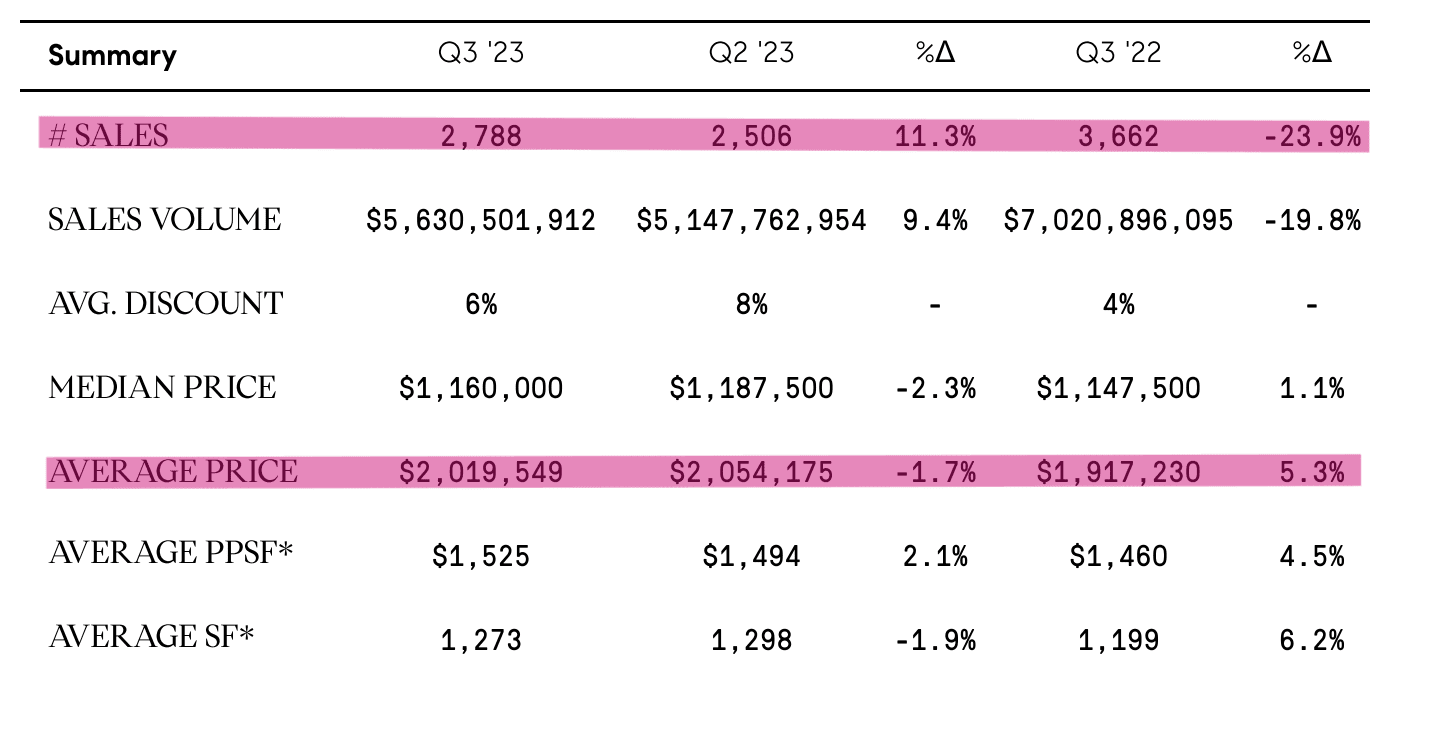
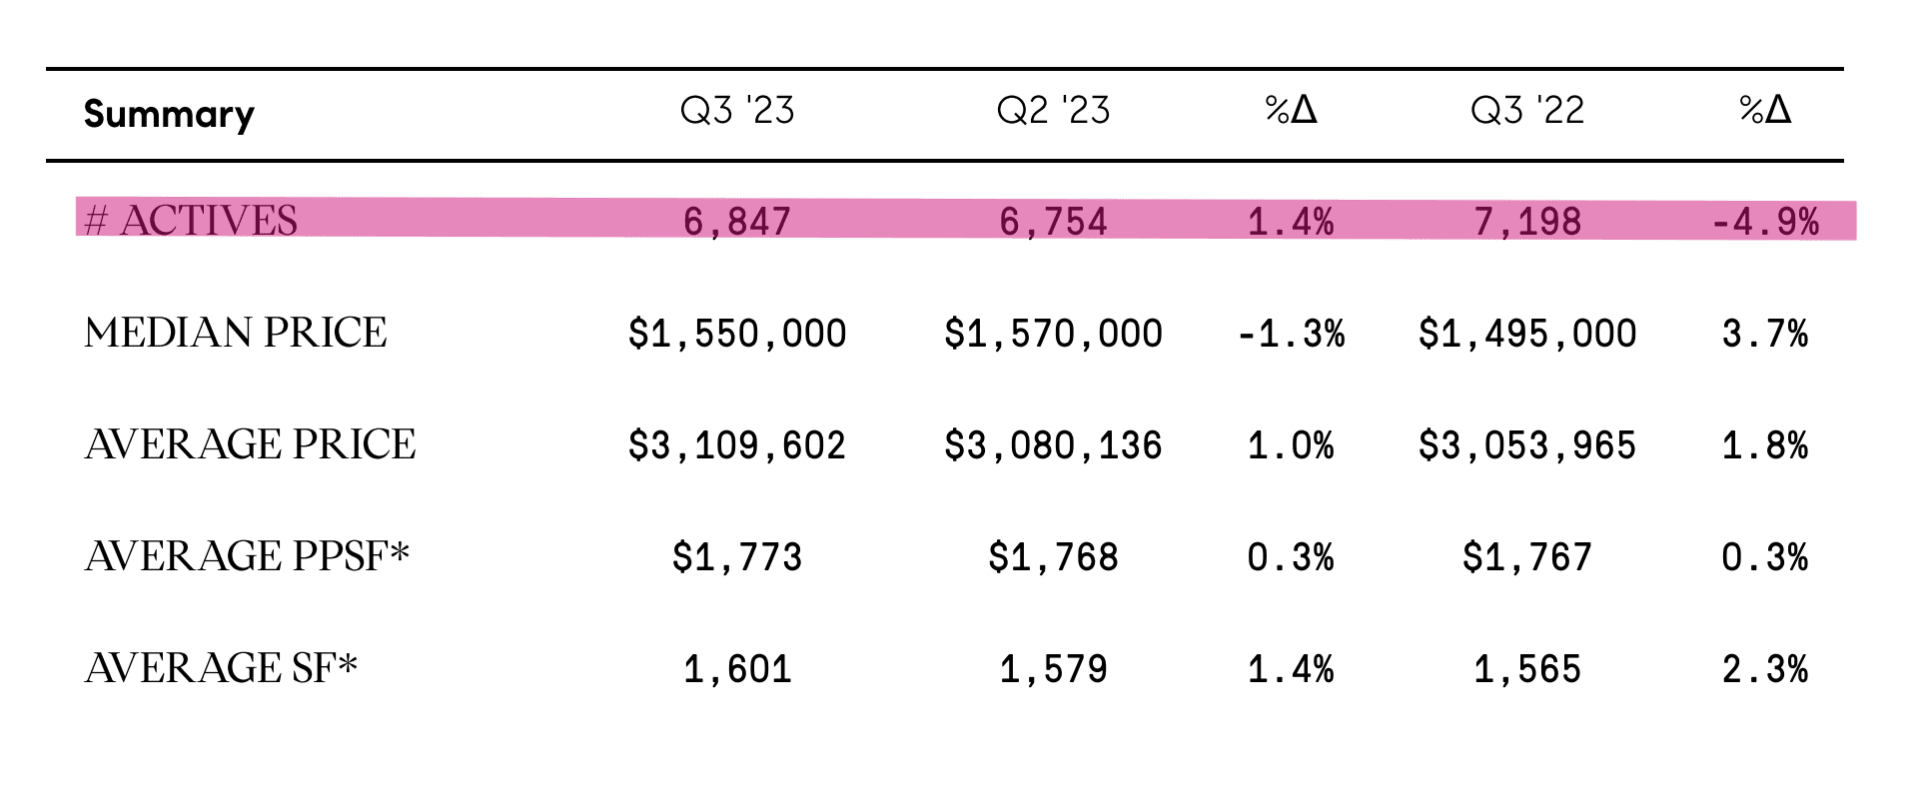
September was the worst month historically since the great recession in 2007. The number of sales for the quarter has shrunk by close to 24% from last year, and the average price also started dropping and now stands at just above $2M. Sellers, I am sure you’re feeling fatigued if you’re currently on the market.
Source: UrbanDigs
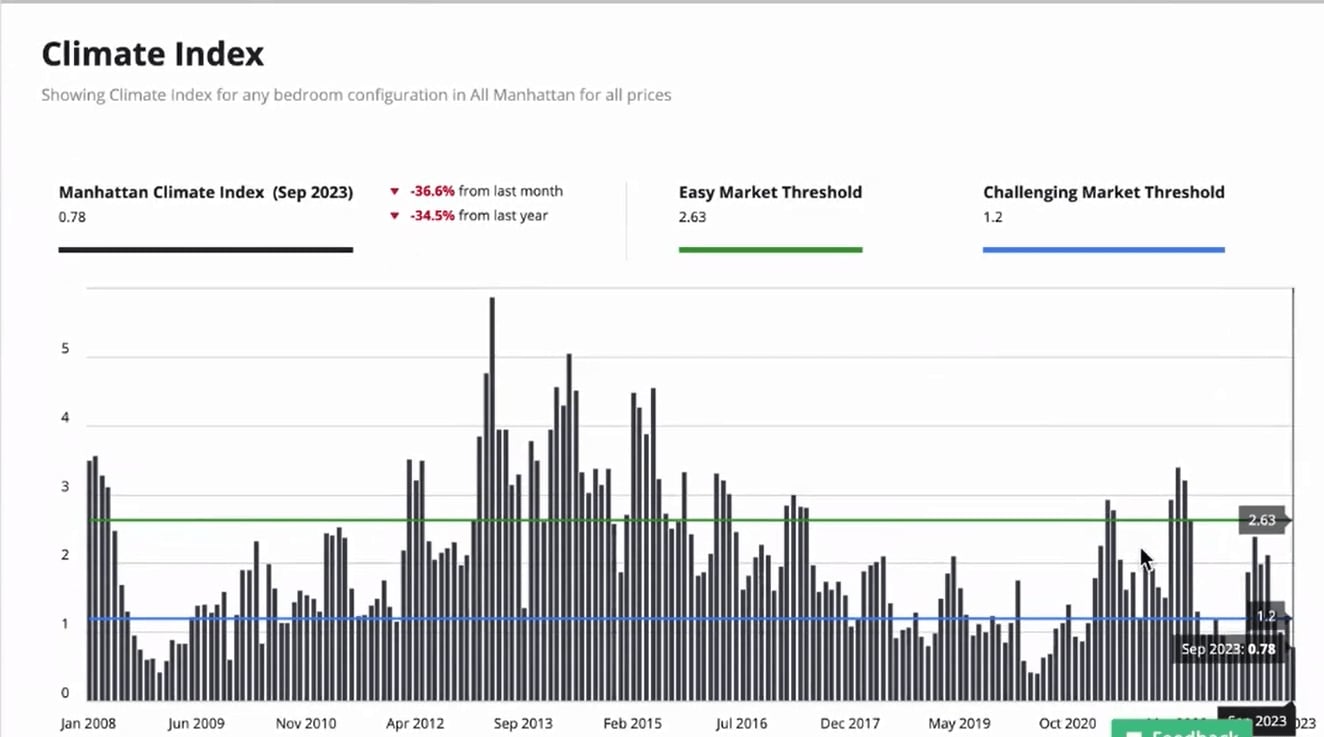
The current climate index is very challenging. This is the ratio between contracts signed and off-market listings, and we were at 0.78 in September, really indicating the massive shortage Manhattan is experiencing in inventory.
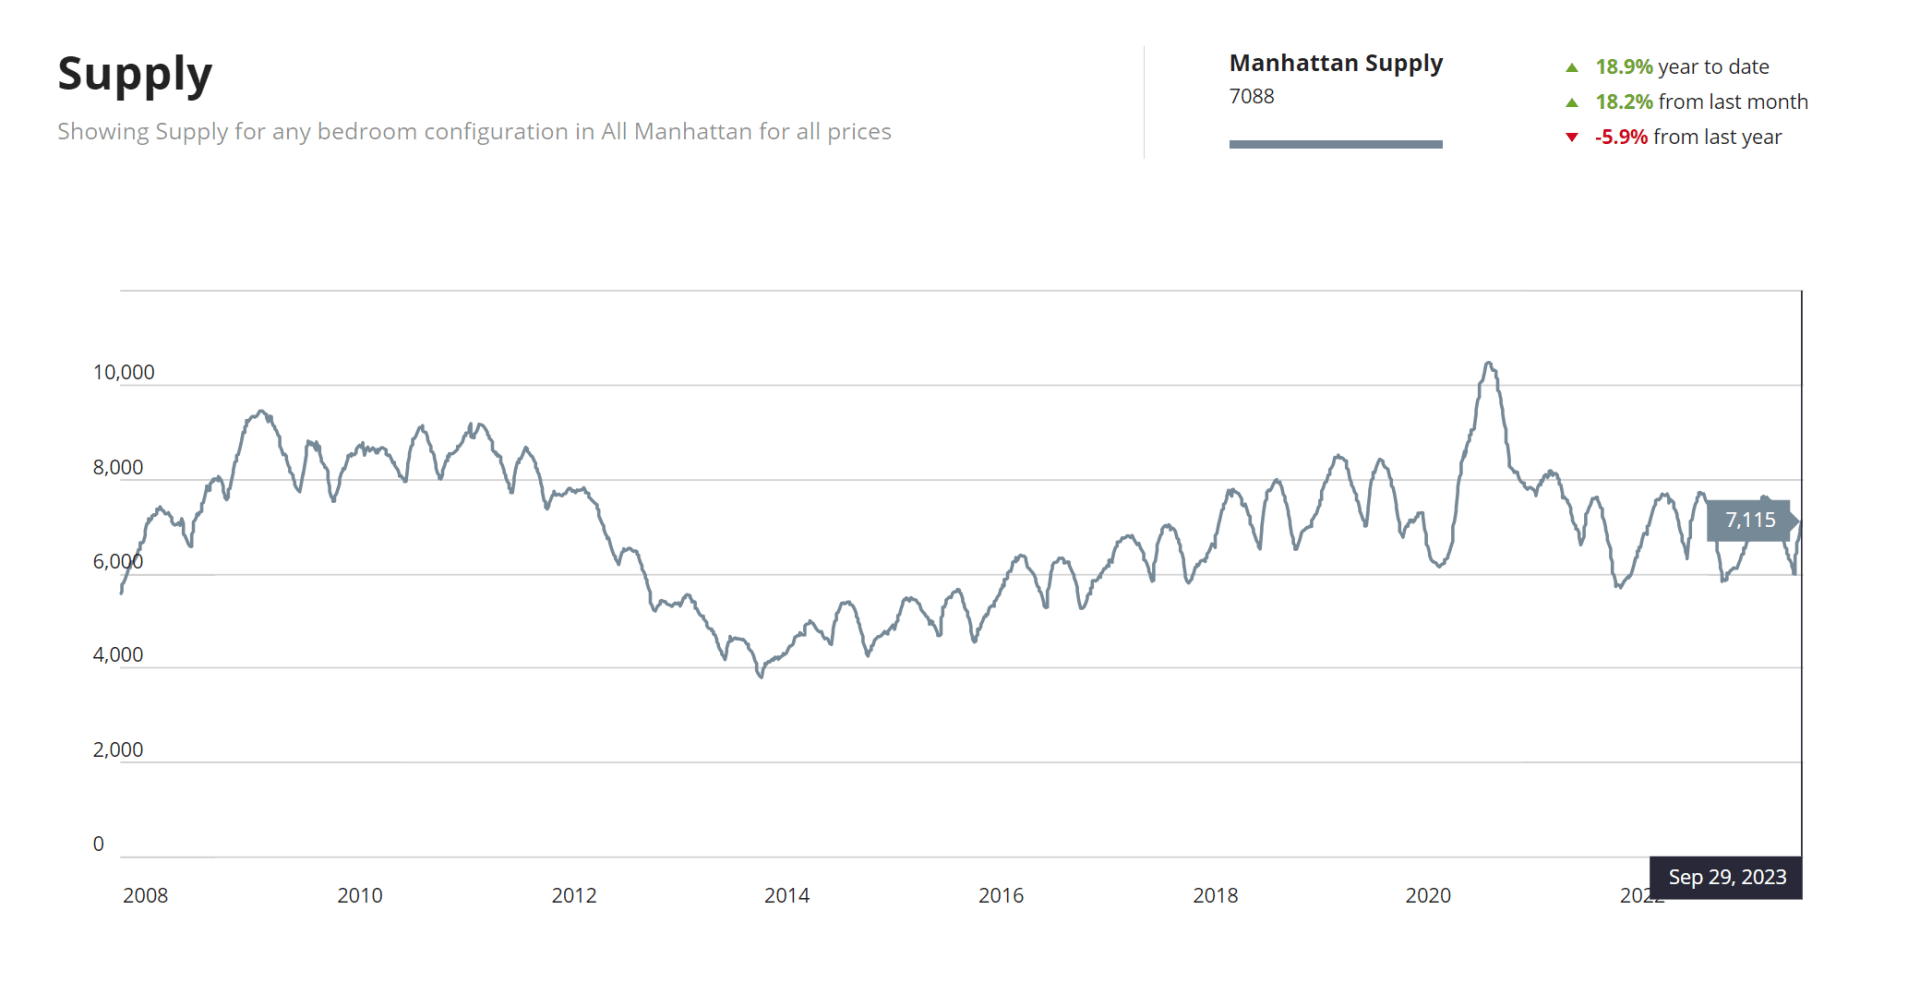
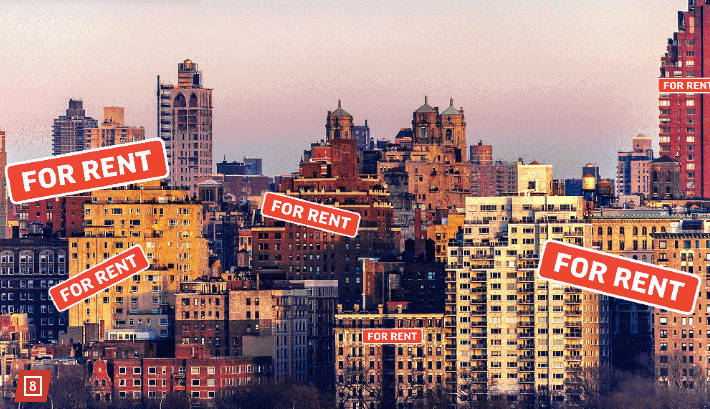
If we look at supply, we closed September with 7,115 units on the market, 18% increase from last month but a 6%v drop from last year. These numbers remain similar when we look at quarter-over-quarter inventory.
Q/Q Inventory
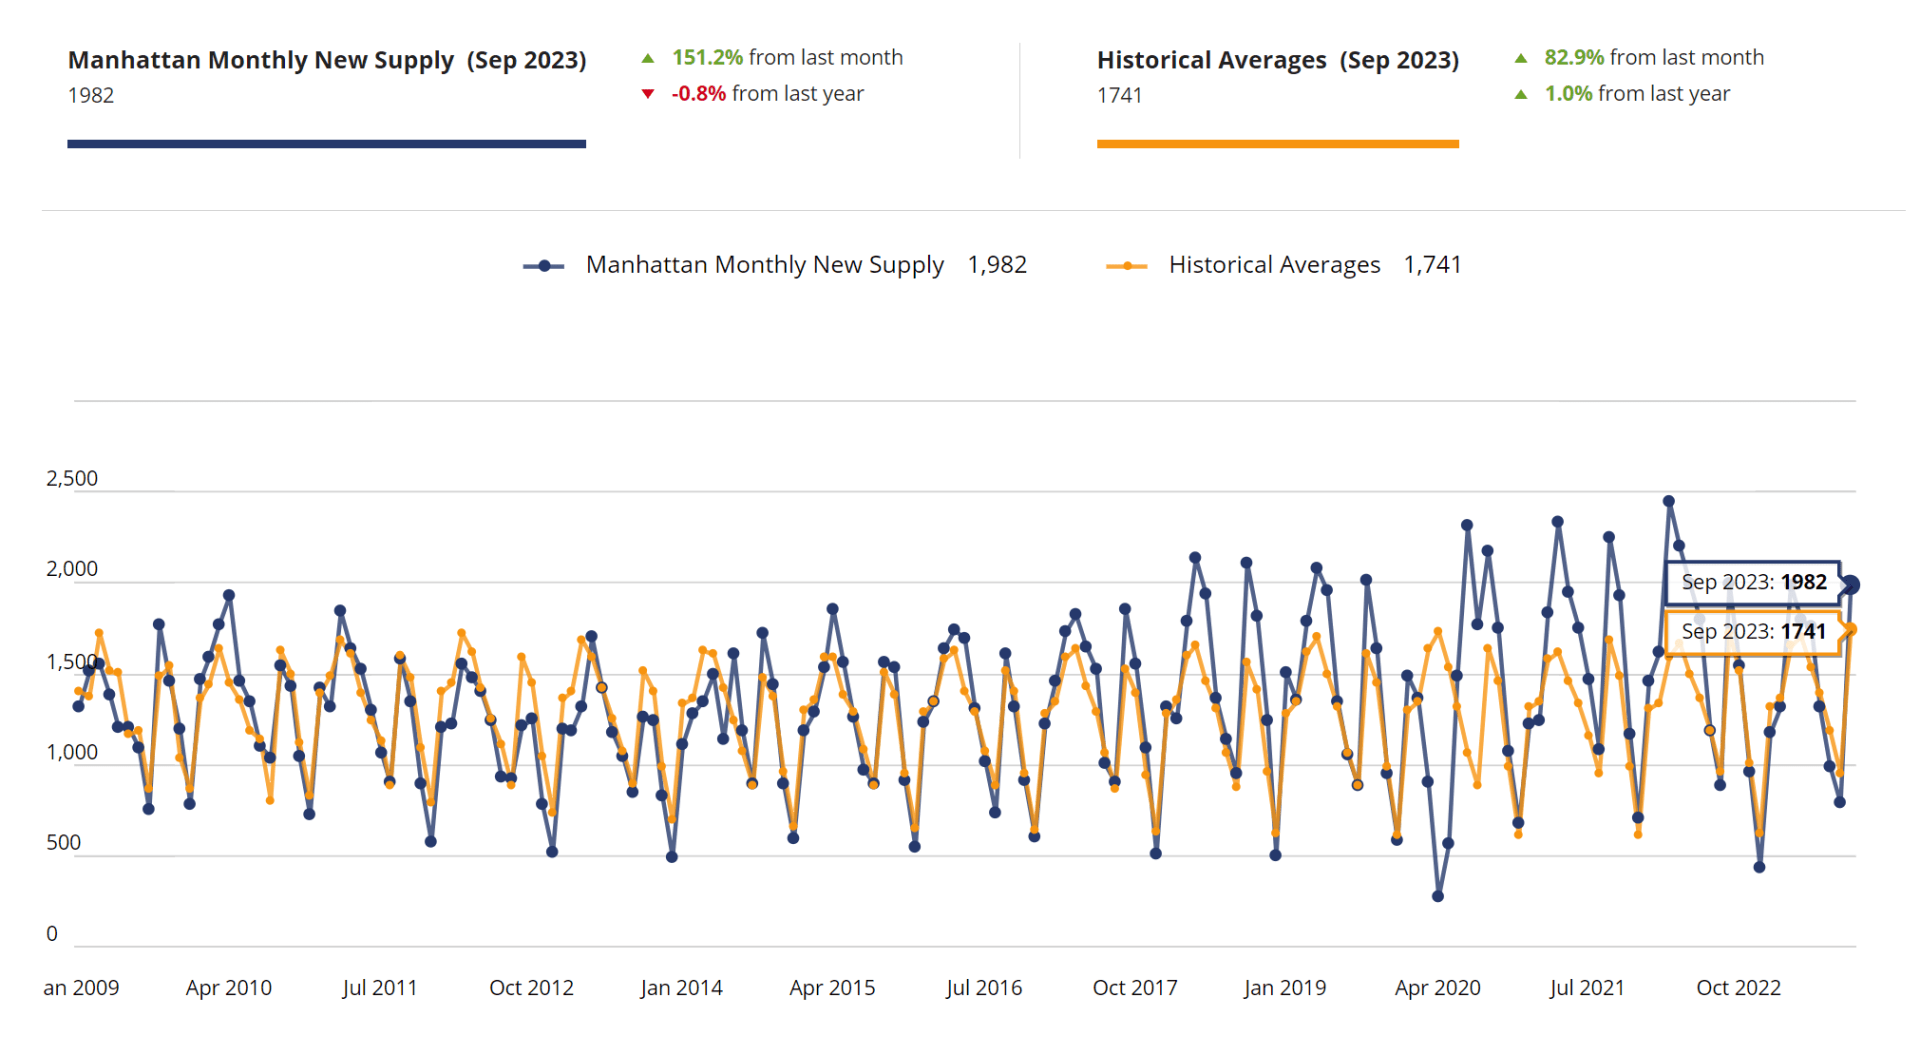
New monthly supply is still lower than the historical averages for the month of September, which is usually the strongest month for new listings and weakest for deals. It is however on a steep climb up from last month with 150% increase, trending above the historical average. Could we be seeing the way up from the bottom?
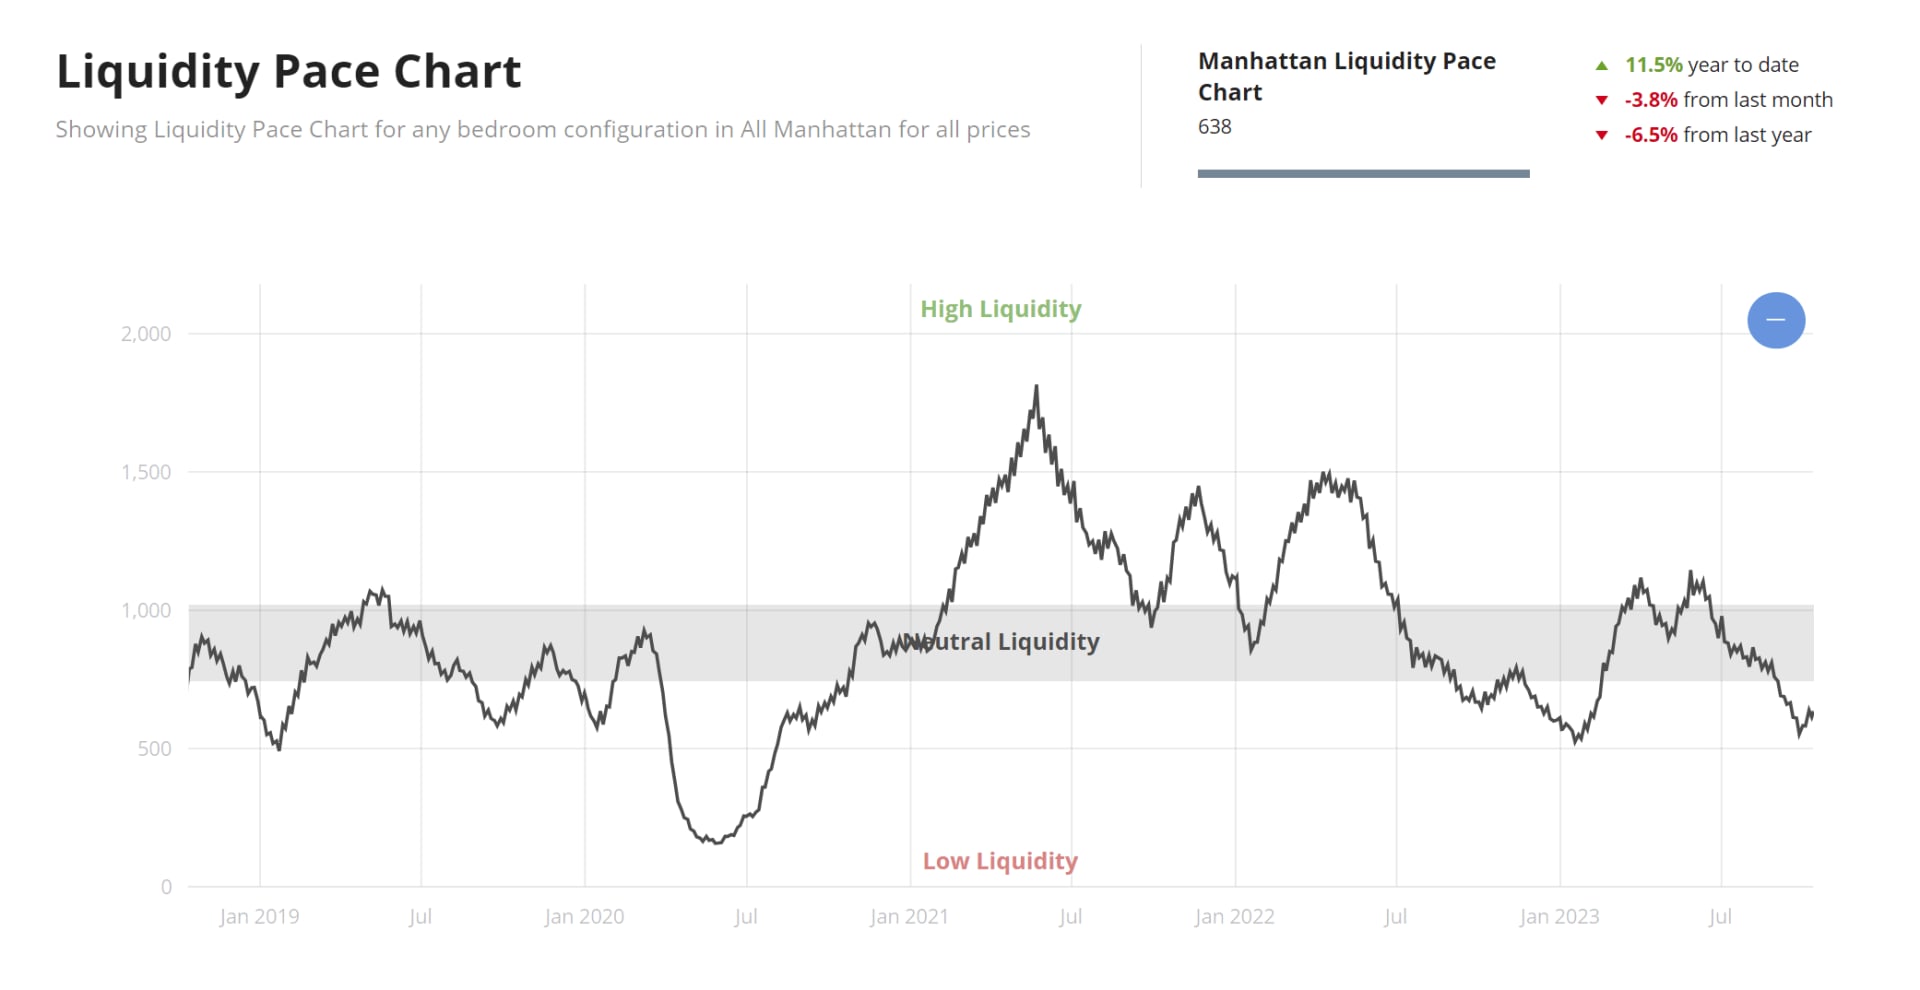
When we look at the pace of liquidity, a moving window of contract activity over 30 days, the signs point towards careful optimism – we may be finally making the turn from hitting the bottom in mid-September, caused by seasonality and holidays. As the number climbs up, it indicates a more active market.
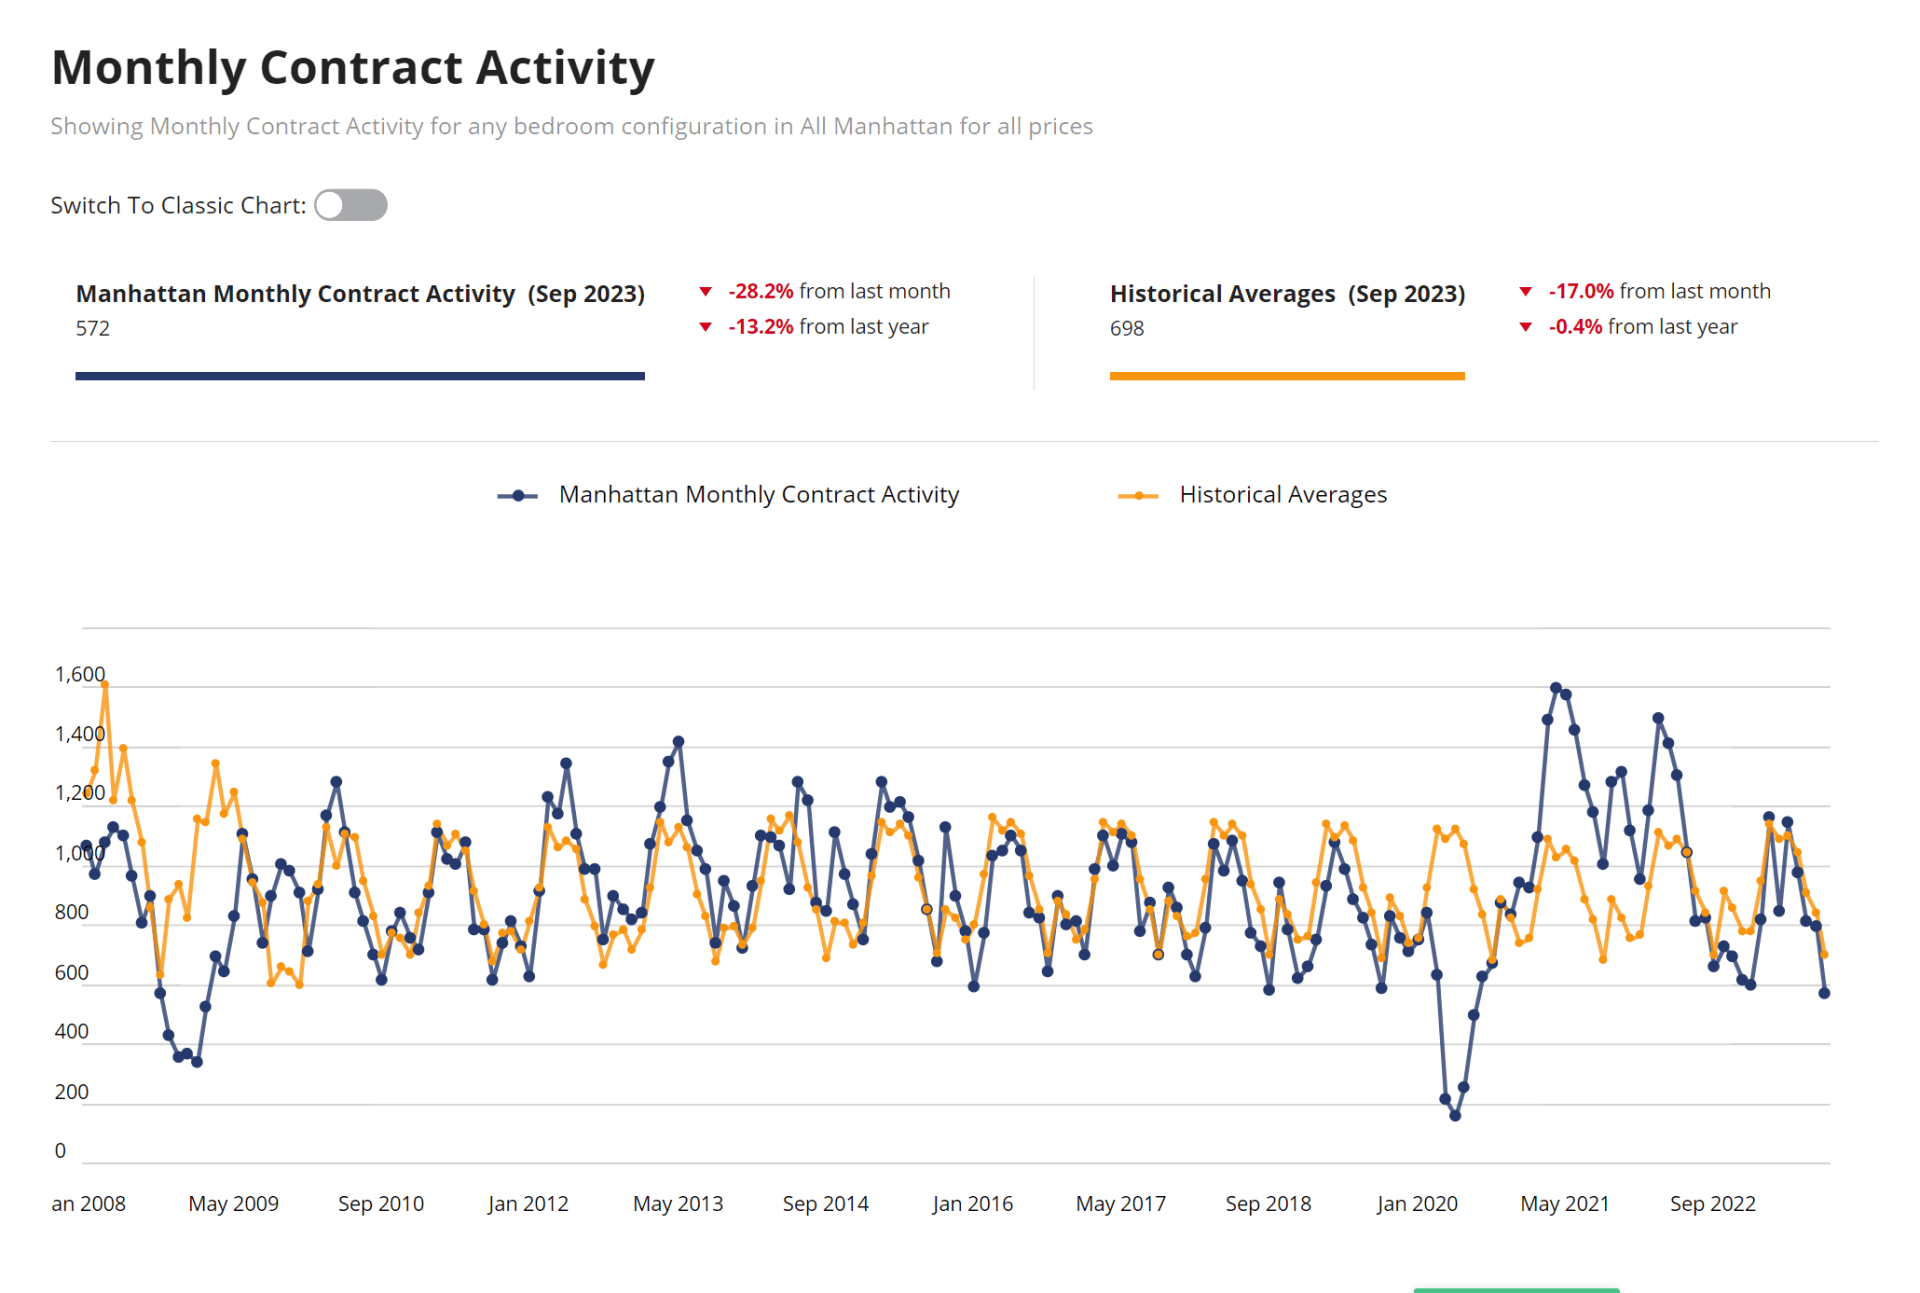
1,969 contracts were signed in Q3, a drop of almost 29% from last quarter and over 9% from last year.
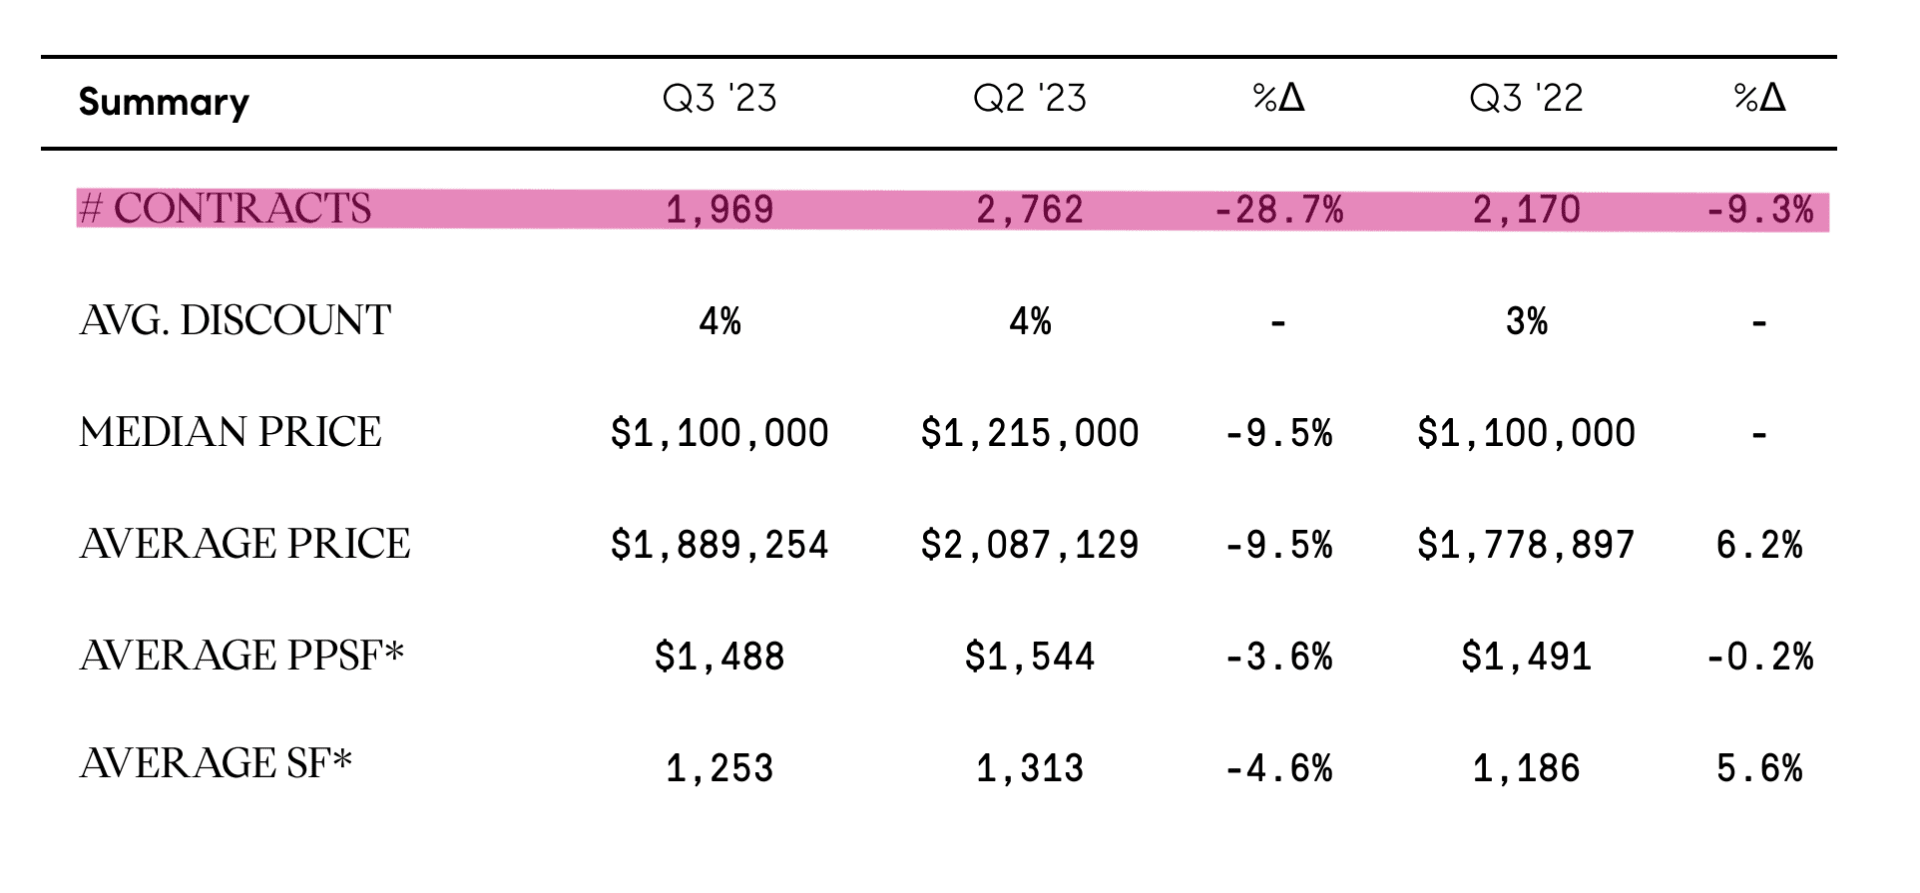
In September we kept falling behind with – 28% lower than last month and 17% lower than the historical average. While we haven’t seen the bottom yet, we expect this number to rise, but it will most likely be a slower recovery.
Days on the market are on the rise, up 9% from last month and 25% from last year, coming in at 84 days. Listing discount is also up 7% from last month and over 33% from last year.
Now what does all this tell us and why is the market the way is it?
First of all, the Fed. The Dollar costs more, which means the cost of purchasing is higher for everyone. In addition to rising interest rates we get a market that pushes out buyers who can’t afford to cope with the rising cost of living. Second, we have a large shortage of inventory. Homeowners who bought at the dirt-low rates of 2020-2022 are either unwilling or unable to refinance at a higher cost, and so are staying put with their current low rates. Whatever inventory is out there is also often more expensive than usual, but not necessarily what it deserves to be, leading to longer days on the market as buyers are hesitant to compromise.
Source: UrbanDigs
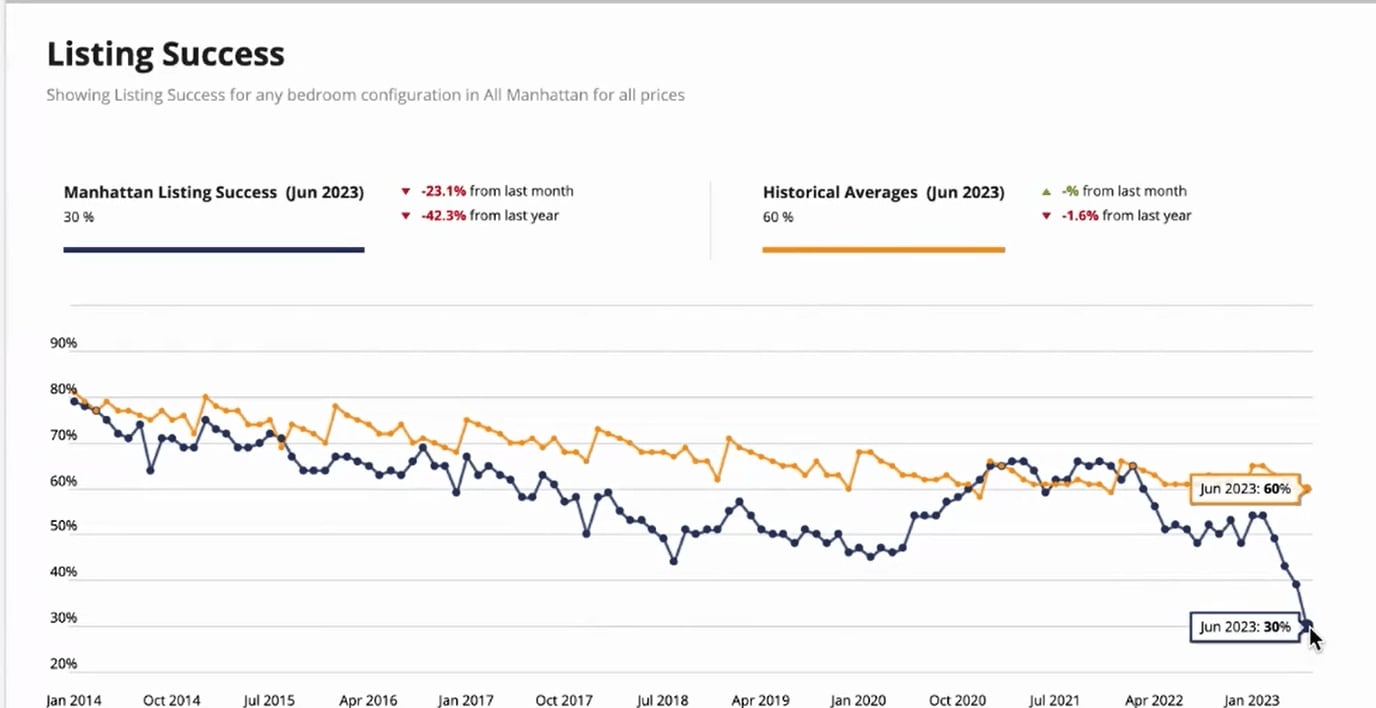
Sellers, all you need to see are these charts: Listing Success, or the rate of success for getting into contract, has taken a nosedive. The climate index is low. You need to be price-conscious and meet buyers where they are if you want to make deals. The price you can get today is not what it used to be in May. There is hope, however: liquidity pace is slowly climbing as we have seen.