
Watch this content HERE
November is halfway through, and the market is cycling down toward winter. What is going on with New York City’s real estate market?
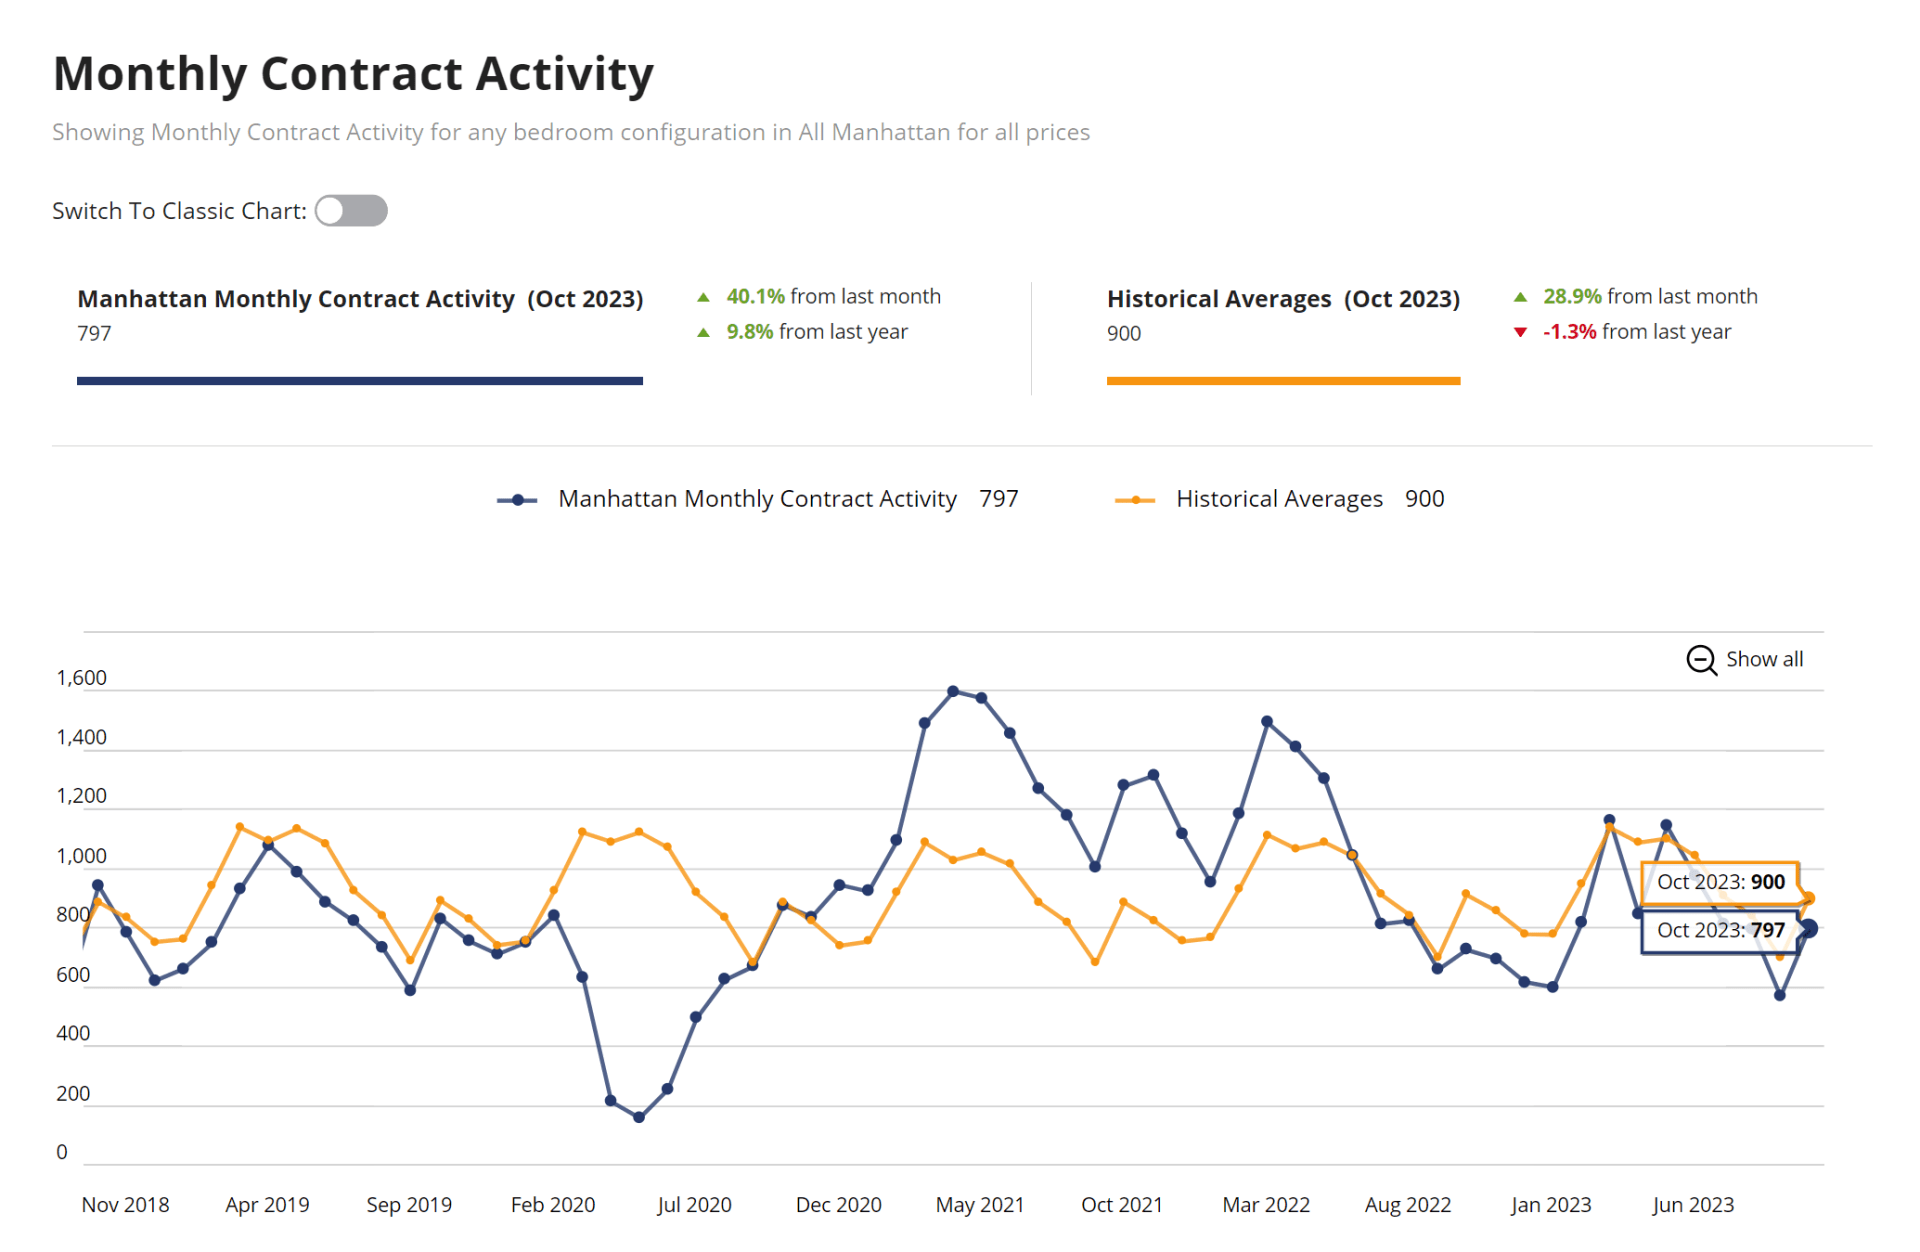
Despite mortgage rates hovering near the 8%-mark, contract-signed activity jumped strongly in October after a sharp decline in September, as buyers quickly adjusted to much higher mortgage rates than earlier this year. 797 contracts were signed in October, a 40% increase from last month. Contracts signed are still on the lower level compared to last year but are not falling off a cliff.
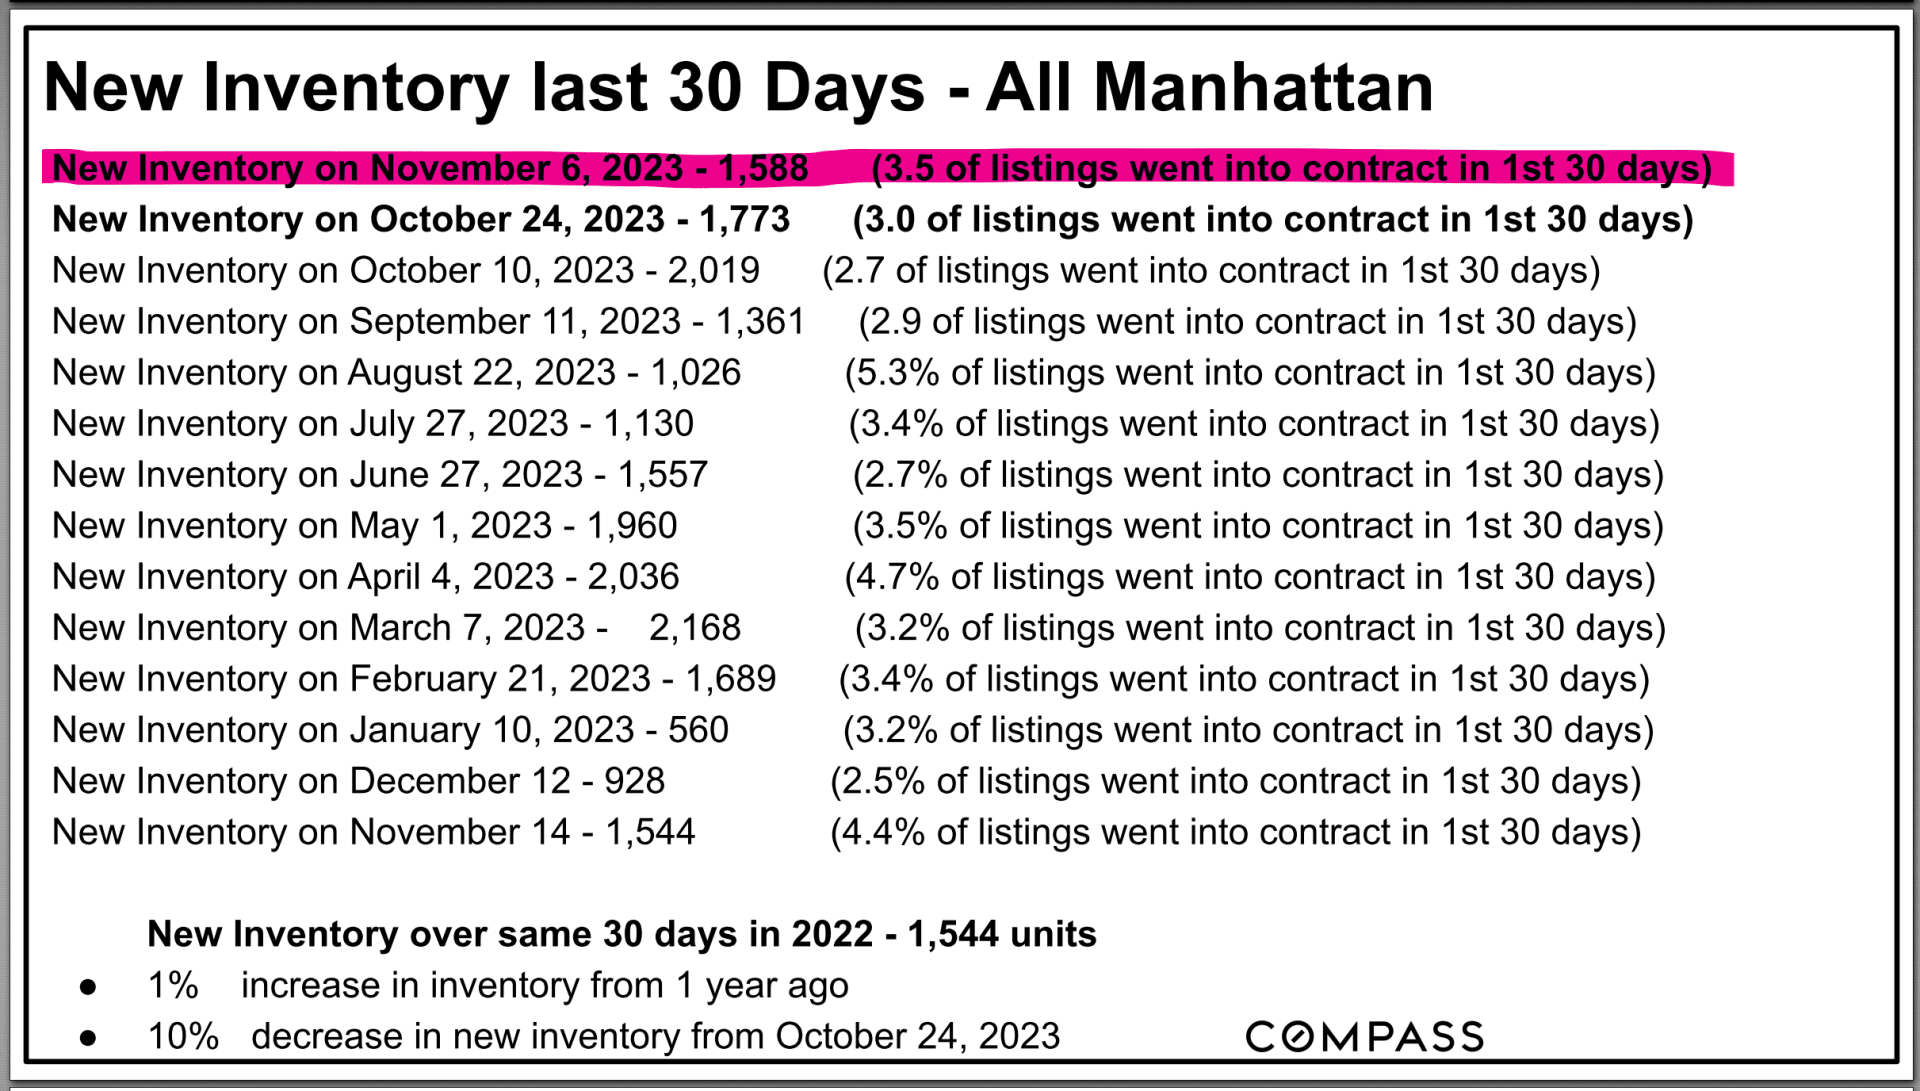
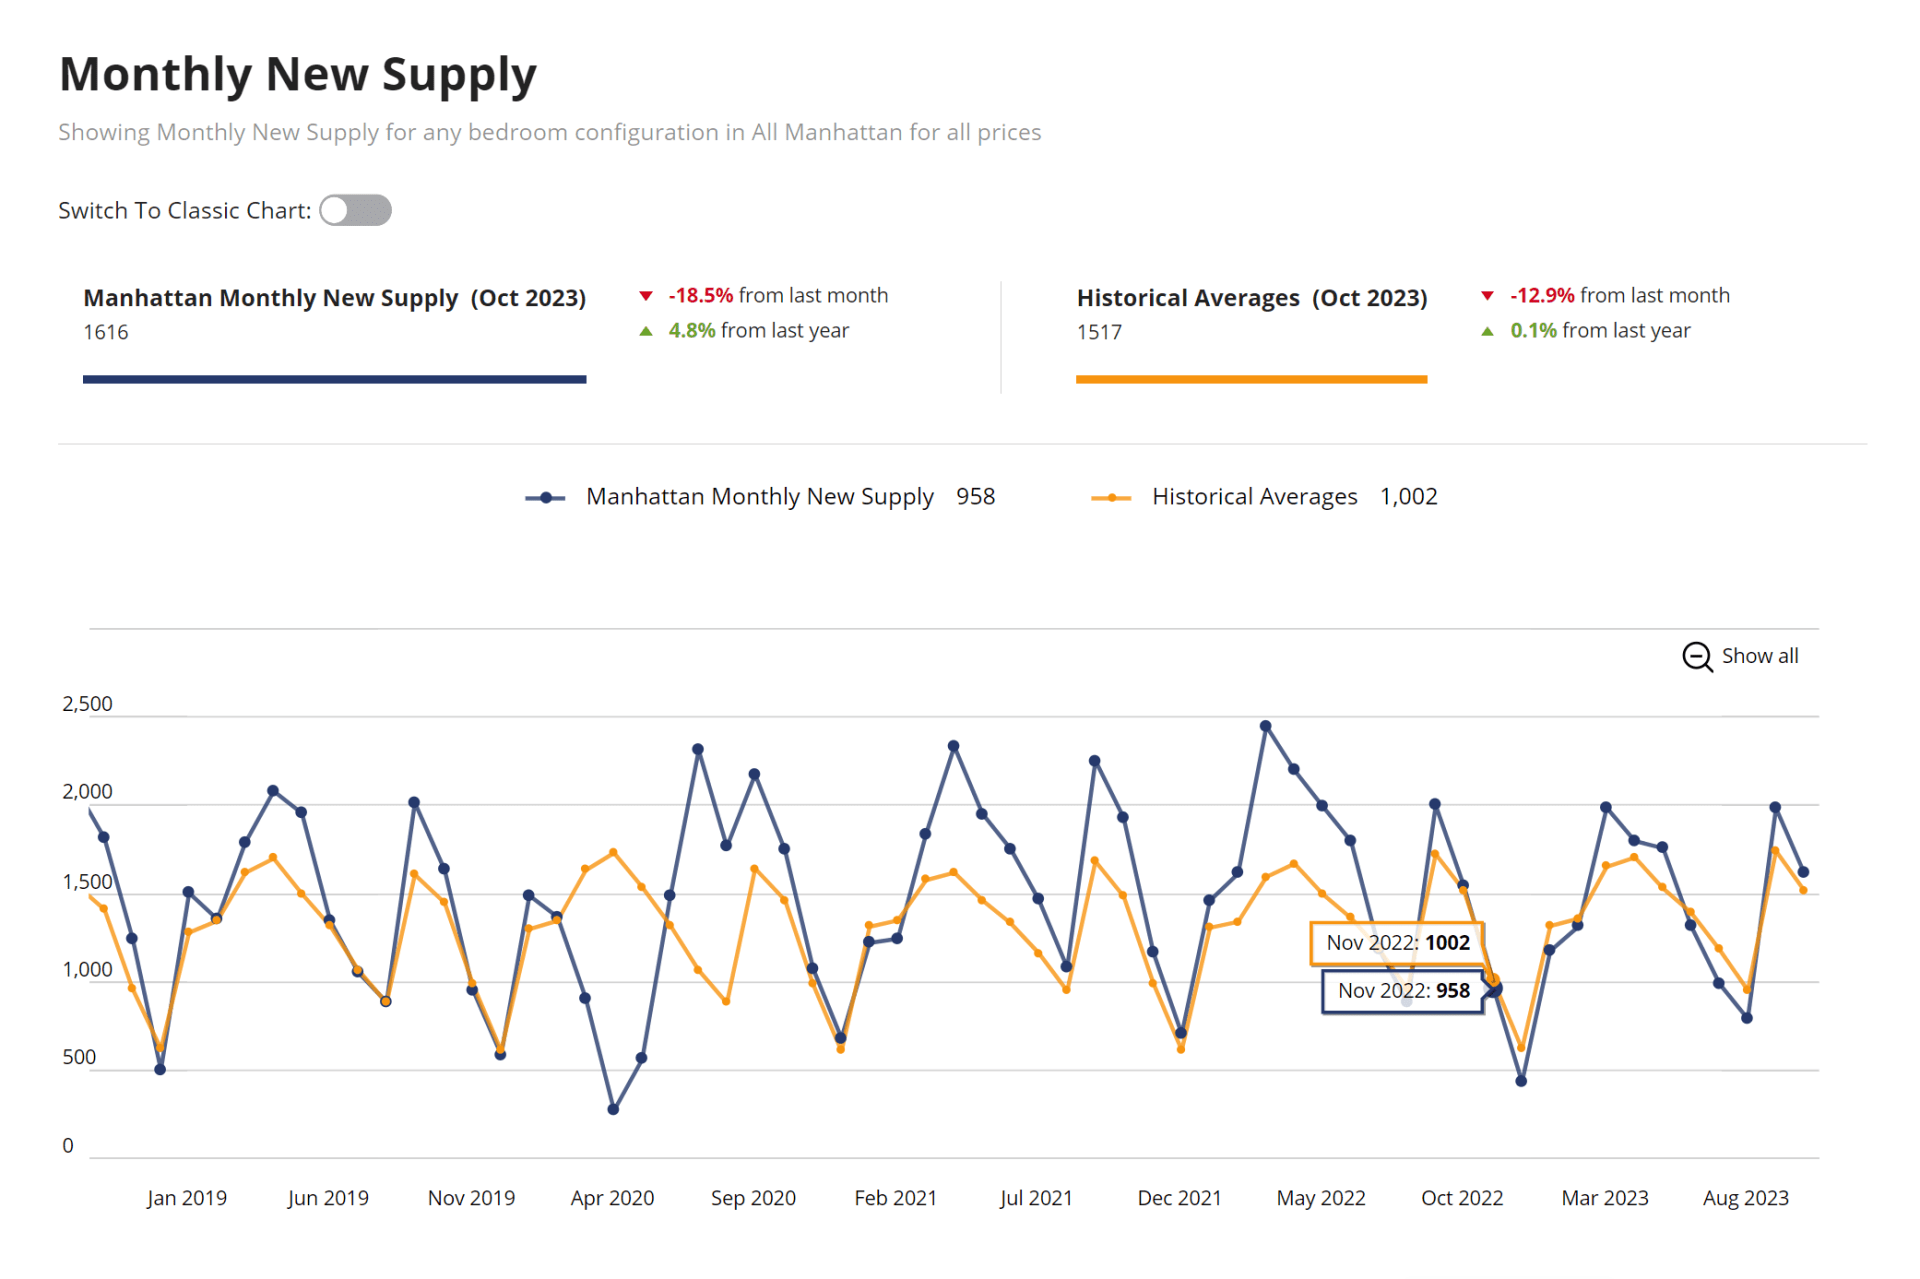
Inventory is getting snatched up quickly – we had 1588 new listings by last week and 3.5% going into contract in the first 30-day window. Inventory has remained steady month-over-month and is nearly identical to the same time in 2022.
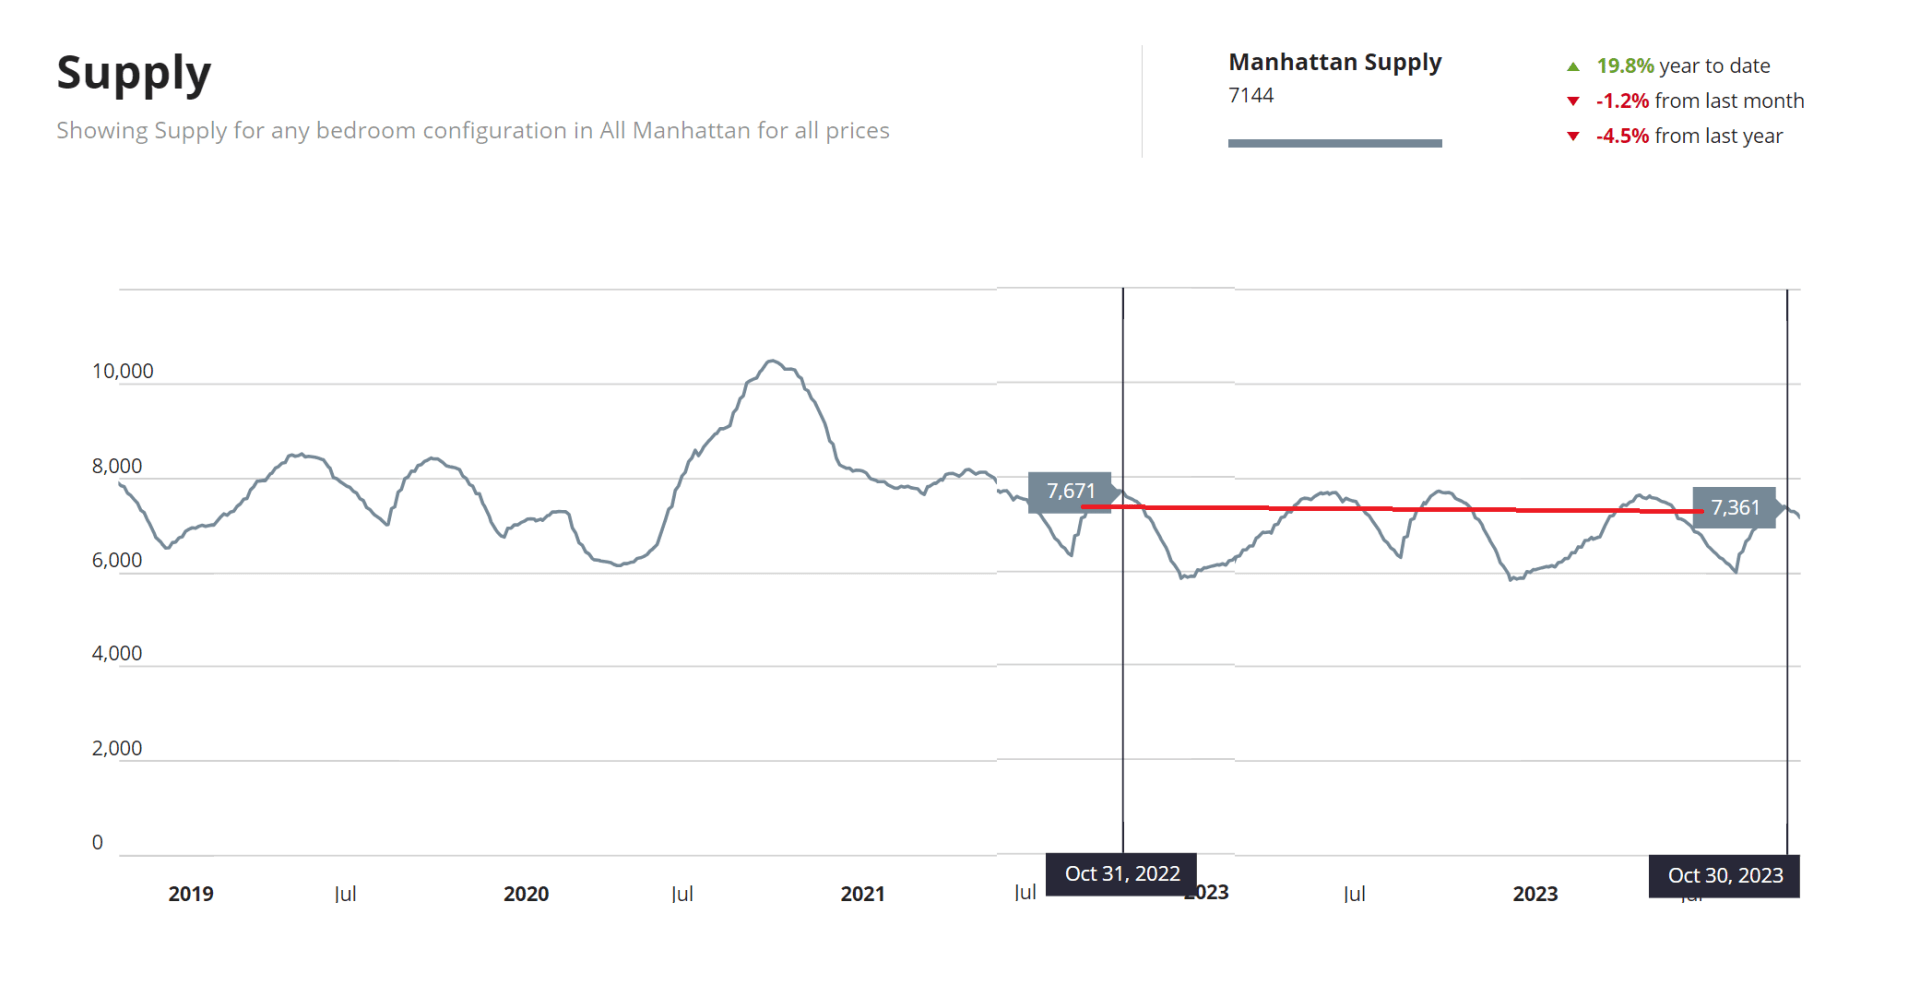
Supply is building despite a relatively slow market, with more new listings than average over the last couple of months, but this is not translating to supply rocketing; it’s normal for the month of October and we do expect to see it drop.
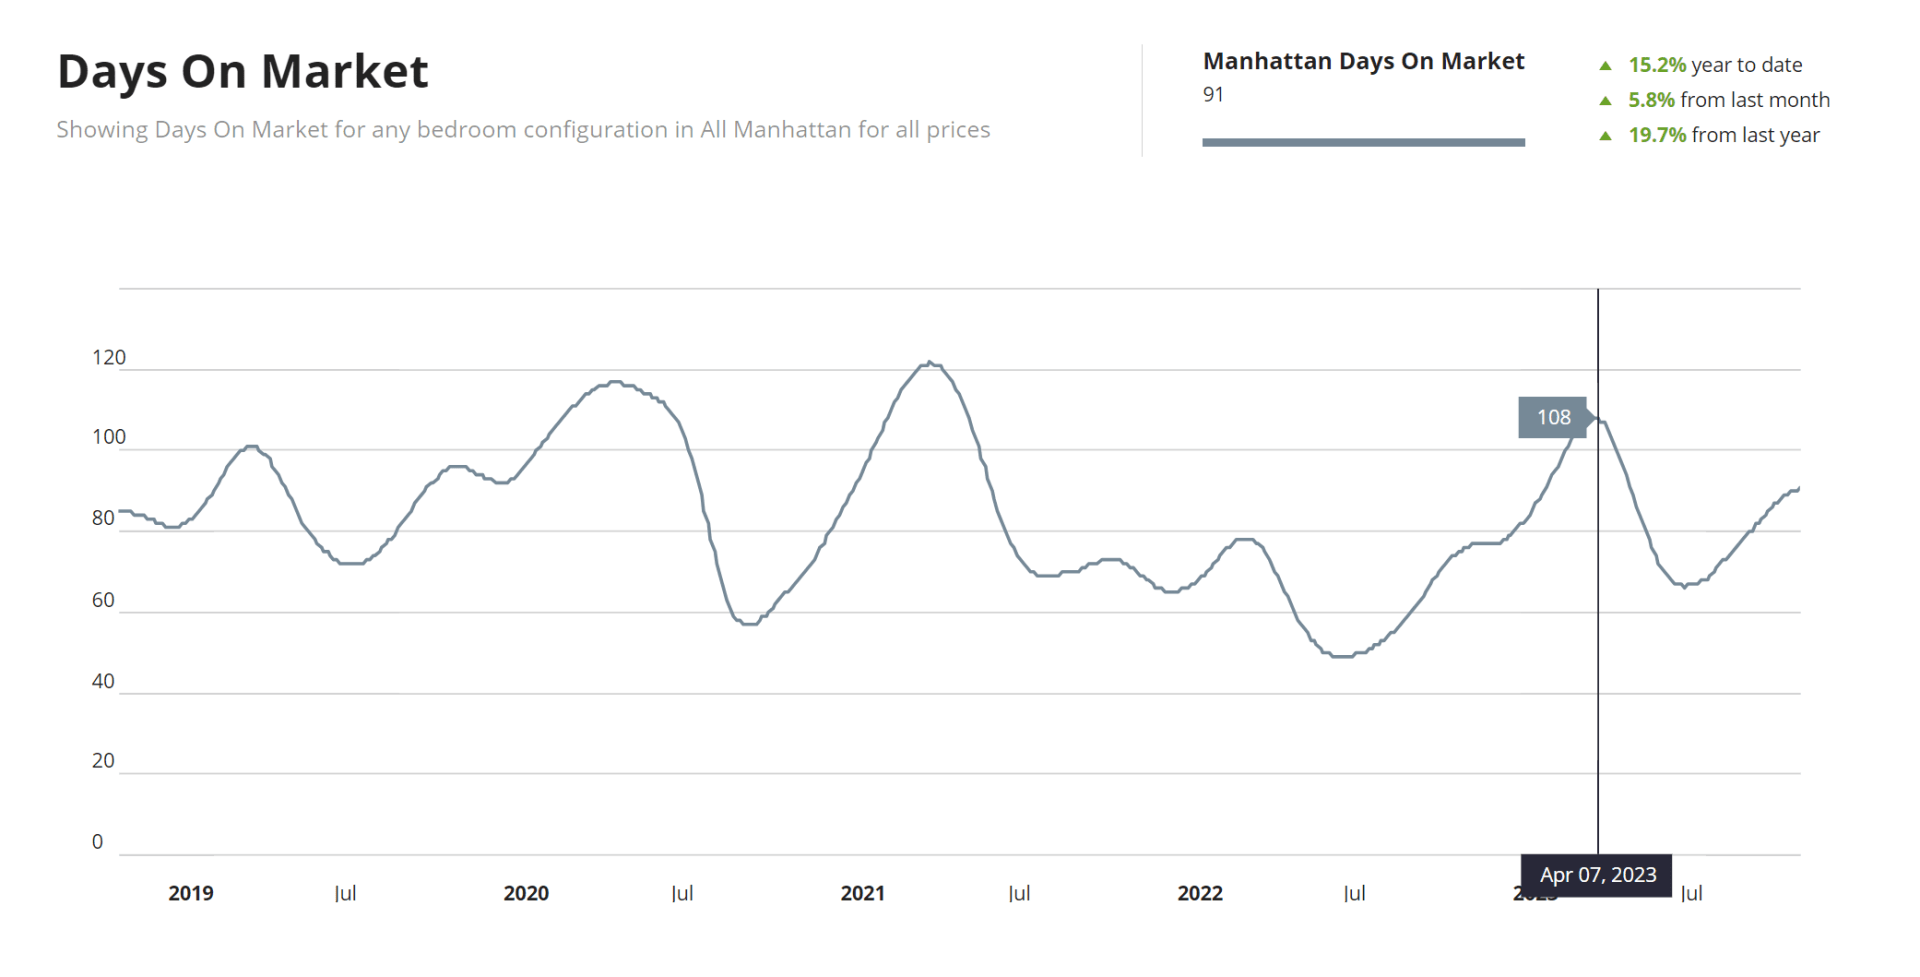
Days on the market are on the rise and now stand on 91. Higher days on the market indicate a weakening of the market but we are still not at the highest numbers – 108 in March of this year for example, and higher in the past 3 years. It is possible that this number will need to rise more before buyers begin to think that these are great opportunities.
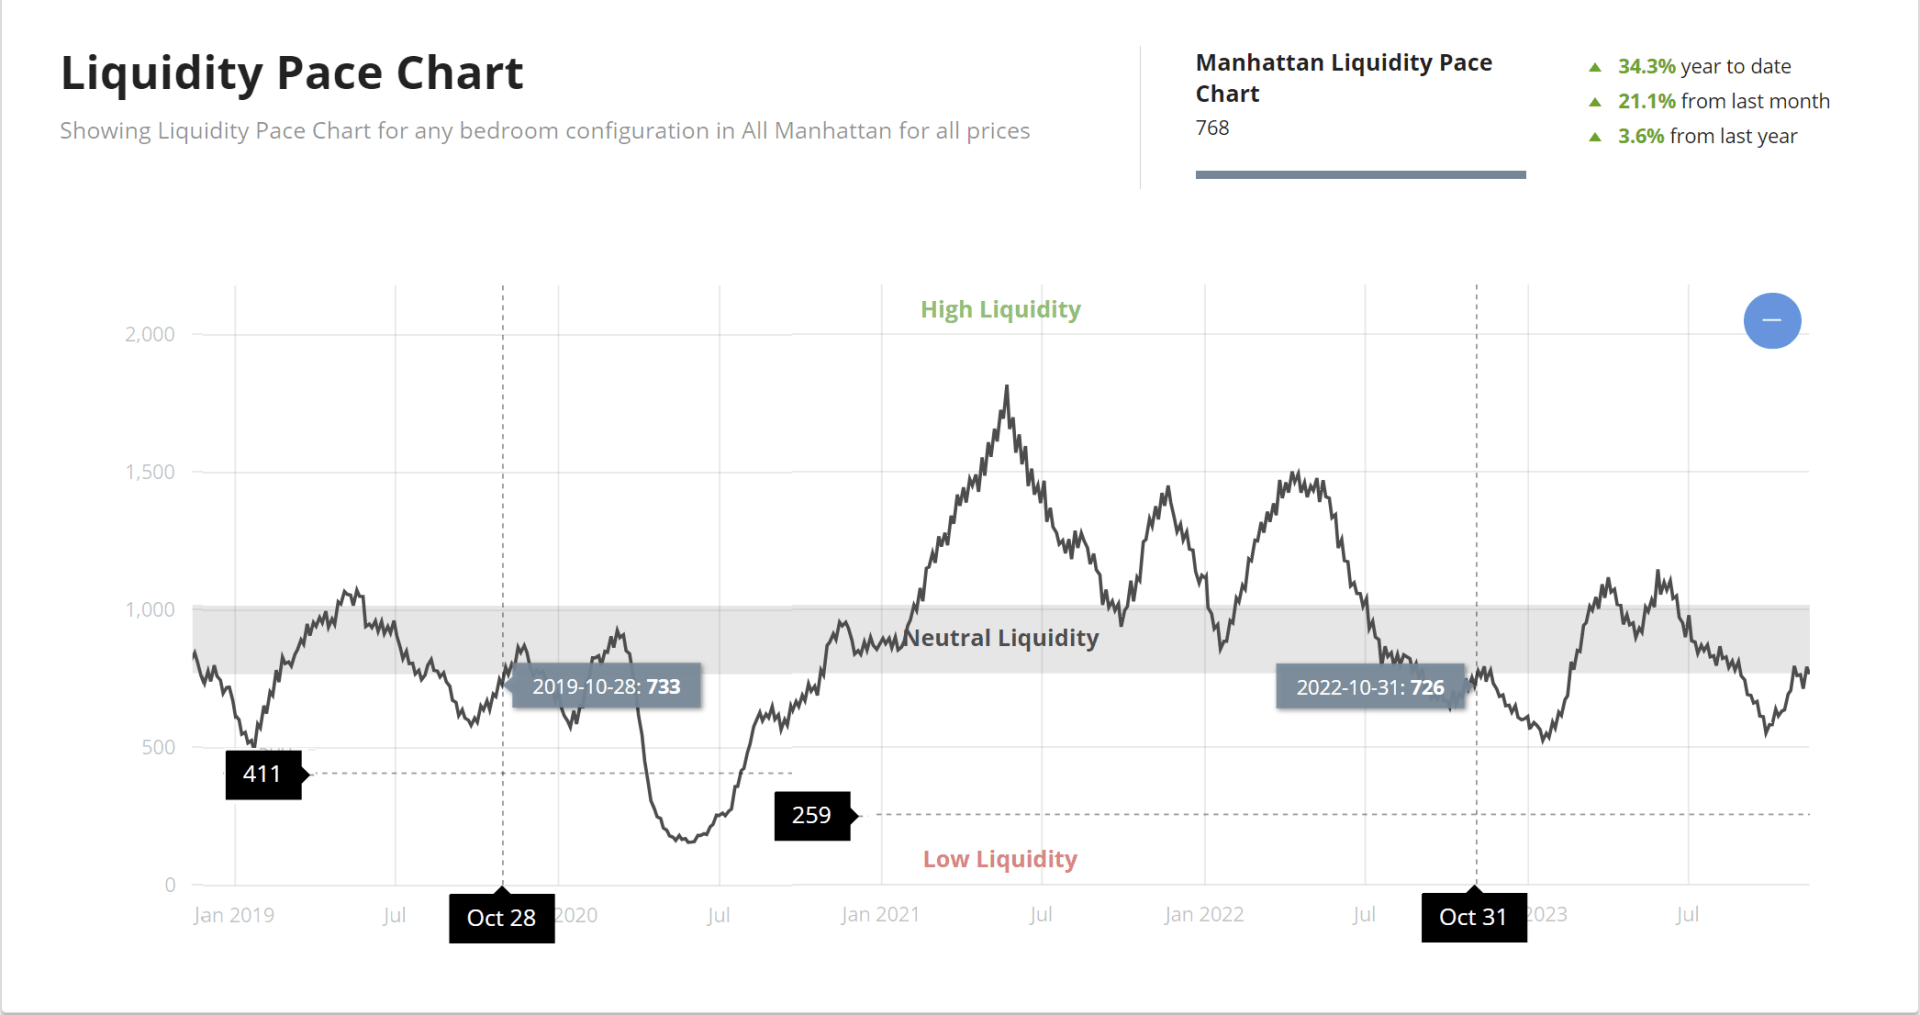
Liquidity pace is still on the lower end of the chart at 768, indicating a slower market, which is seasonally normal. This is a progression of a down cycle over the last few months and is below average for November numbers. We are, however, beginning to see an uptick, indicating that the market may be strengthening.
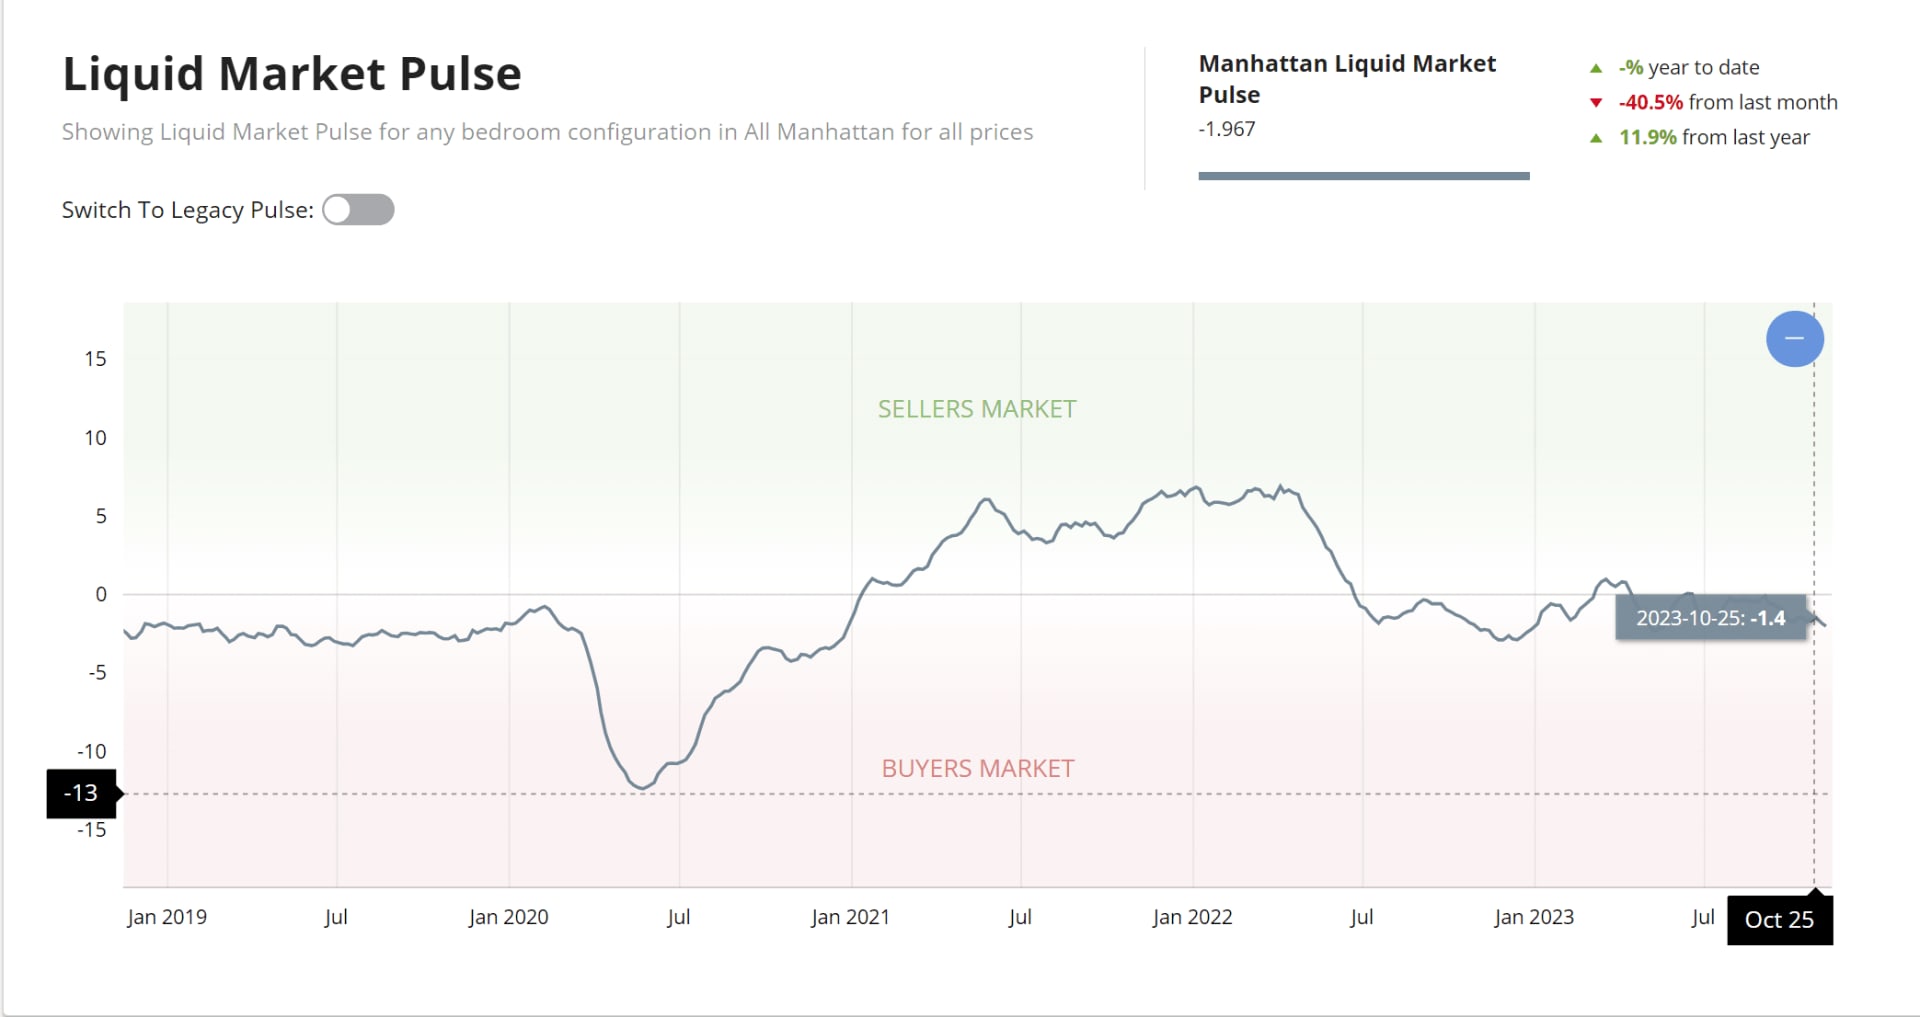
Liquid market pulse, the relationship between active inventory and liquidity pace—or supply and demand—is still in buyer’s market territory with a sharp 40% decline from last month, but no real change year to date. Listings are declining this time of year and we remain on a declining listing volume trend.
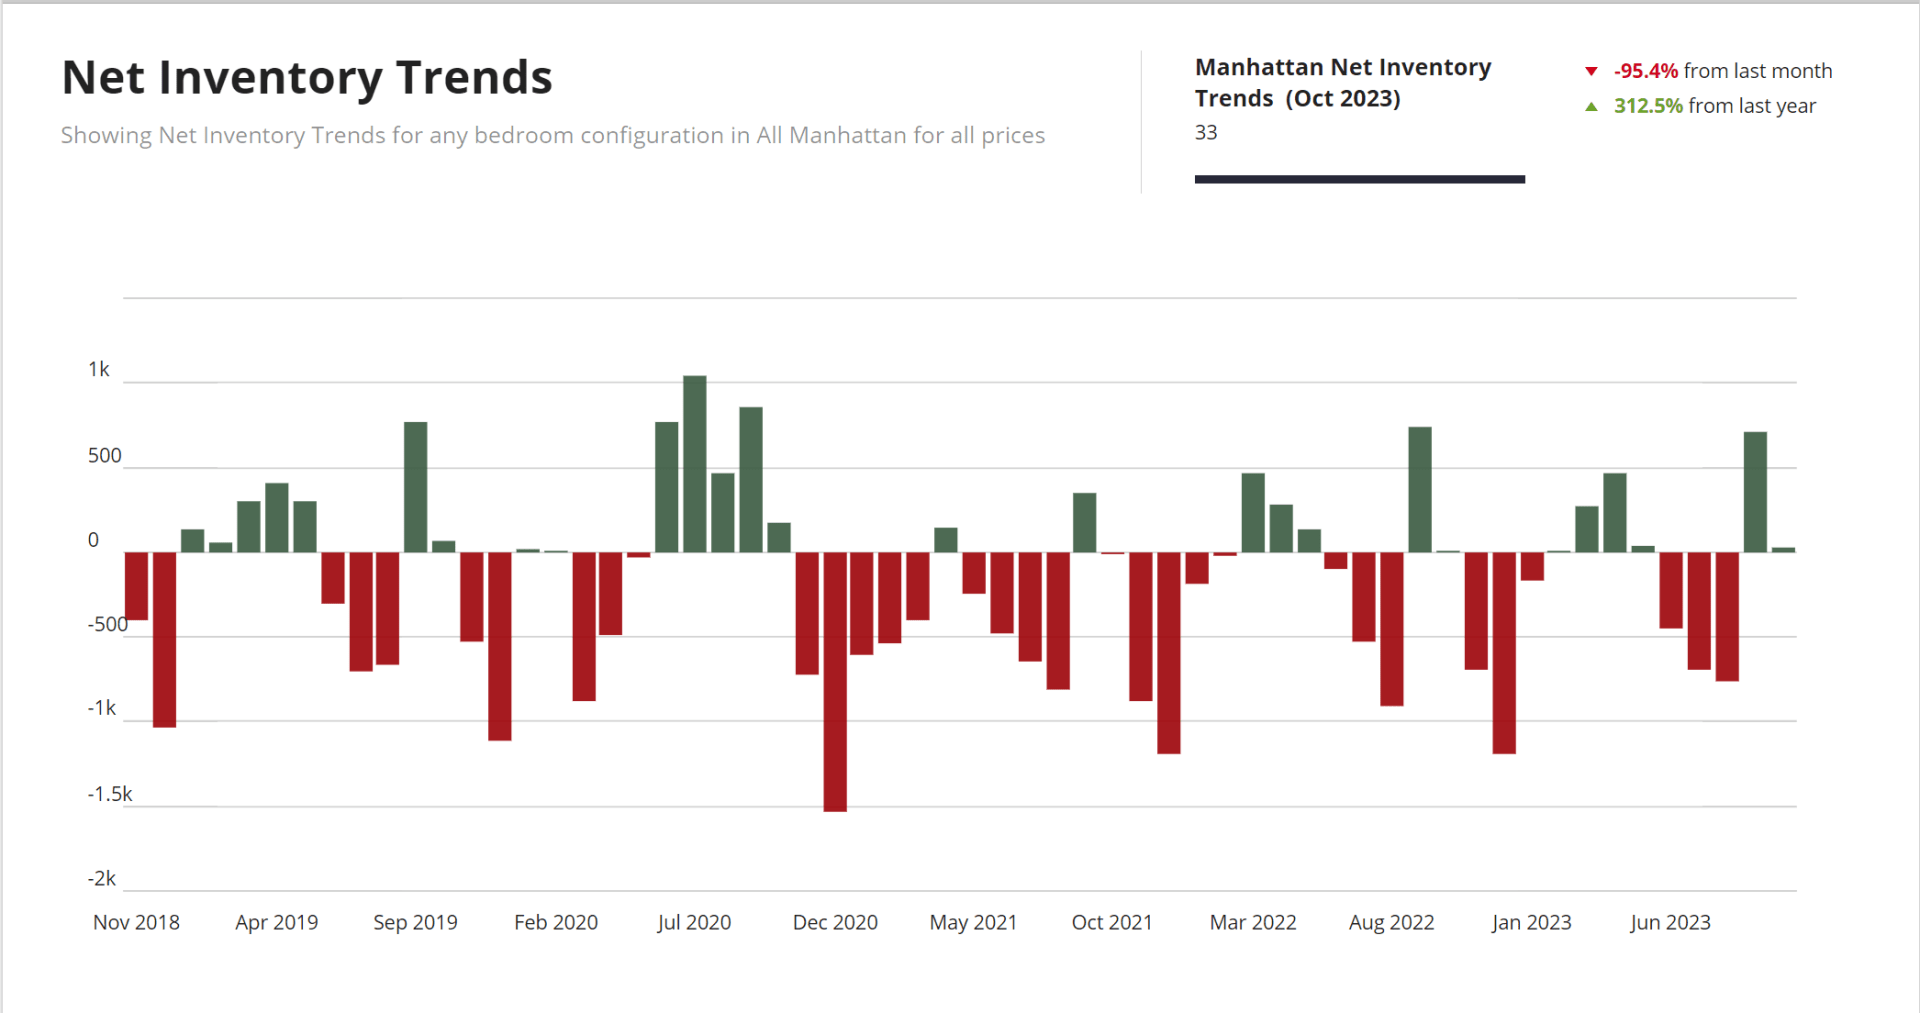
Net inventory trends, or the pace of new inventory after subtracting contracts signed and units removed from the market, show a small number of listings on the market after a drop from September. November through January is the time of year when it really falls, as we can see in the chart. Buyers, this seasonal trend indicates that new listings just aren’t going to come onto the market in the next two months.
Looking at the data, we expect opportunities will be available and the market will change. However, this is the market to buy in, when price action I already down. On the sale side, less inventory doesn’t mean rising prices.
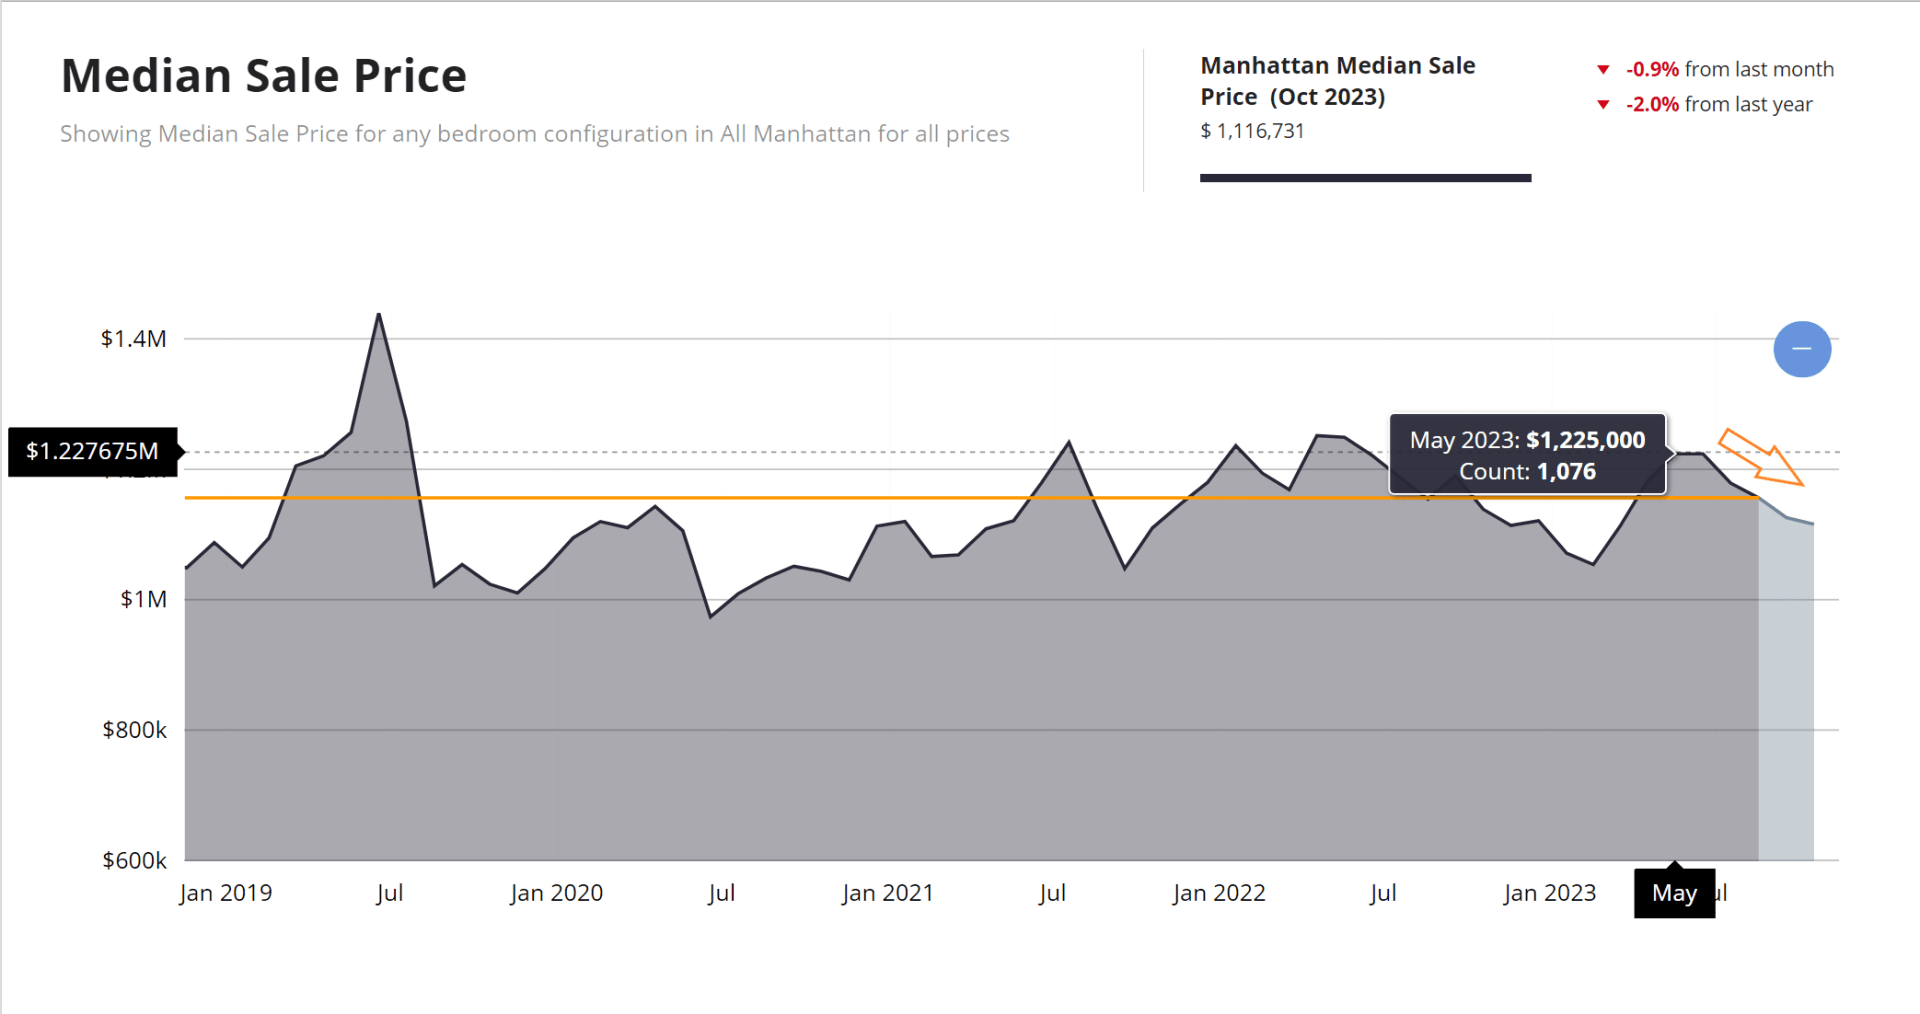
Prices have been coming down since the spring and this may ease the sales side competition, but it doesn’t solve the problem of lower demand. We see less seller competition, but also fewer buyers. If you’re a seller, don’t think in terms of prices but of competition: who are you competing against and who has come through your door to see your property. Really make sure you’re priced right for this market.