
Watch this content HERE
July is here and with it, we look back at the second quarter of 2023. With economic uncertainty and rising borrowing costs affecting New York City’s housing market, we saw buyers and sellers rethink their priorities and adjust to this new normal. The real estate market slowed but remains surprisingly resilient. What else happened in the market?
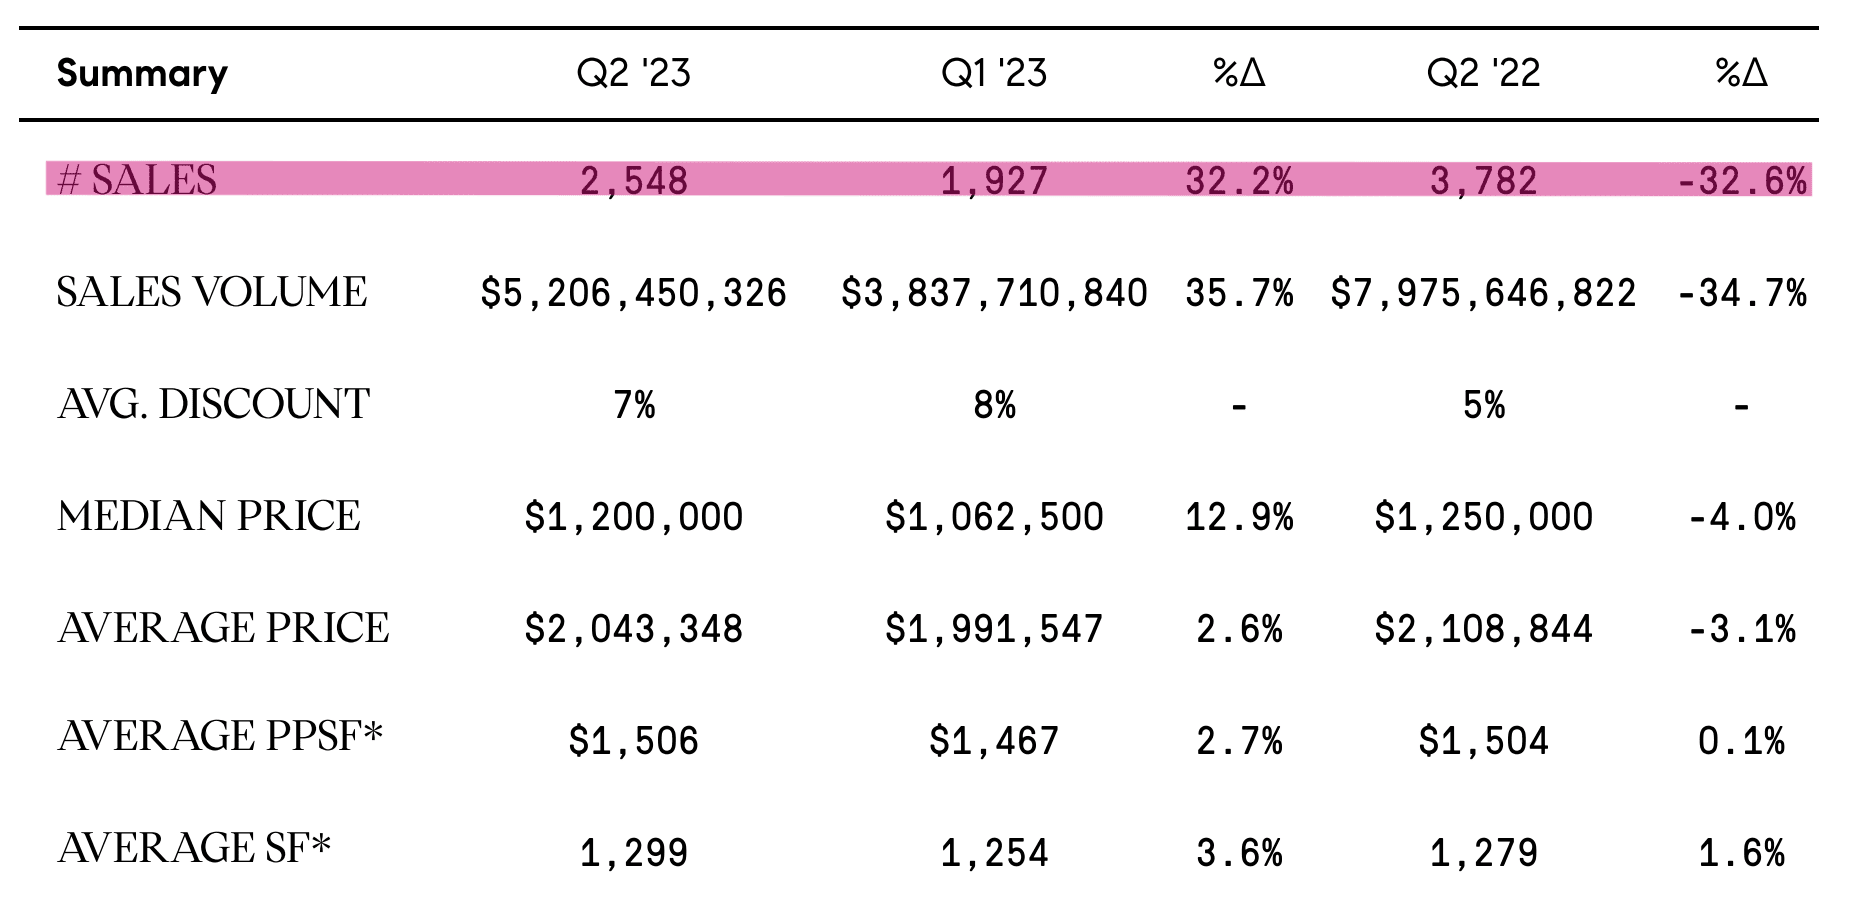
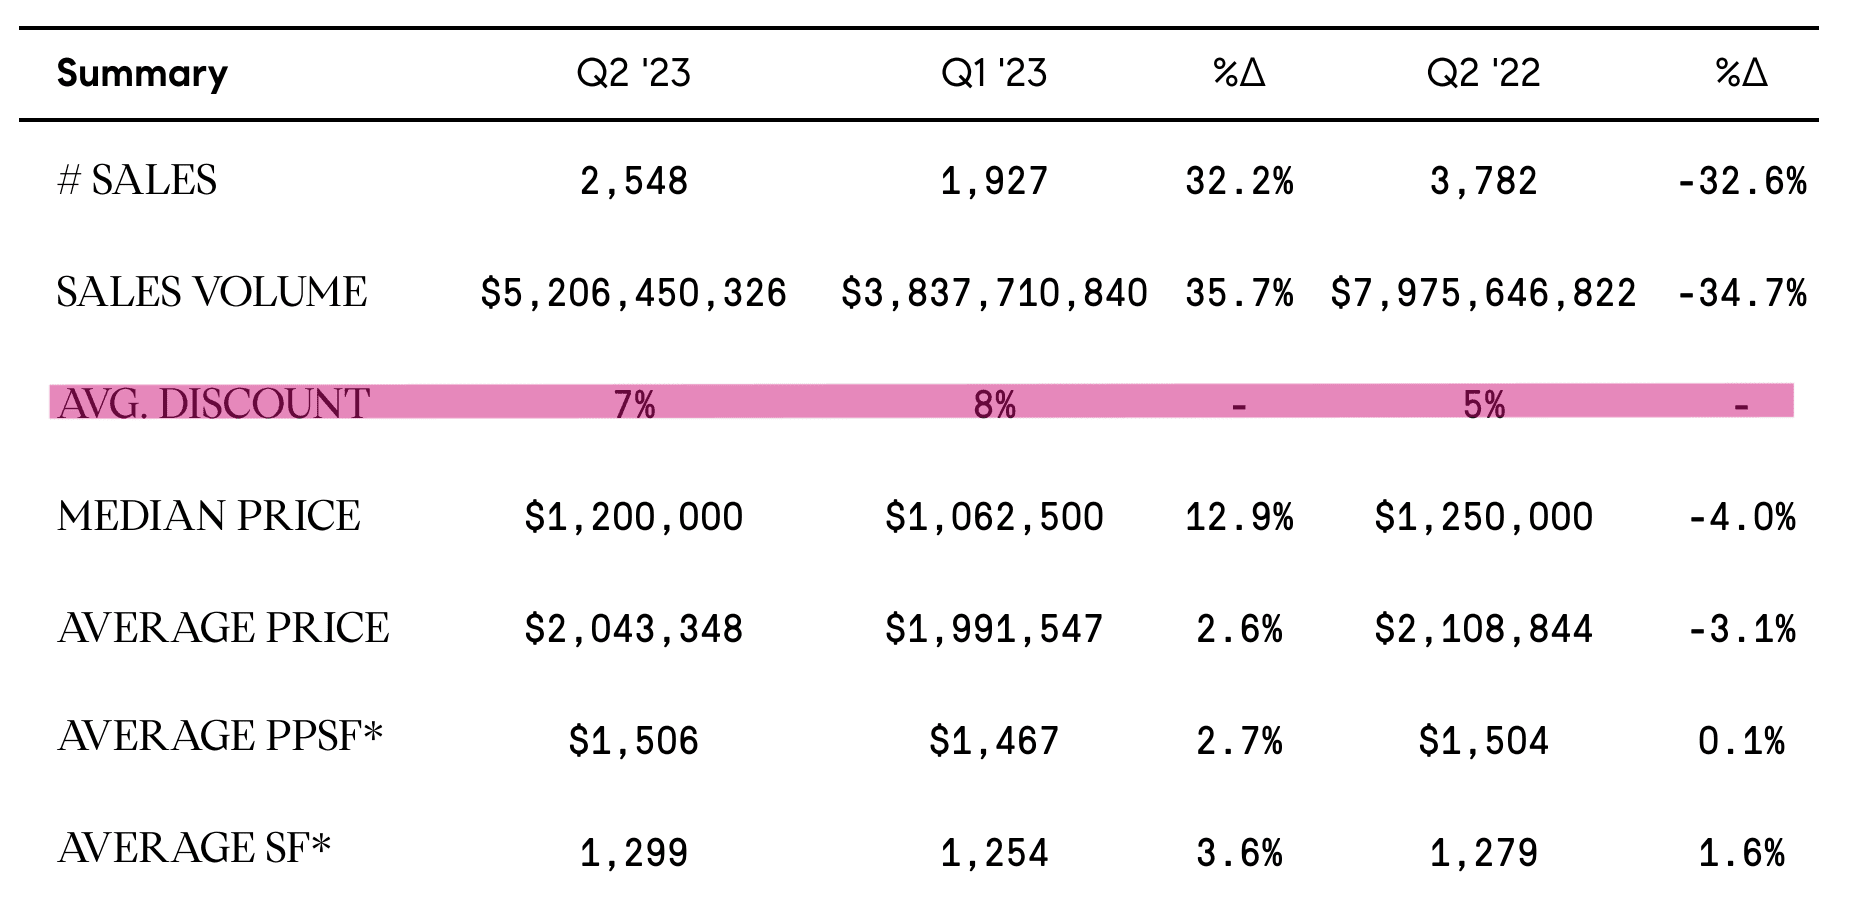
Source: Compass
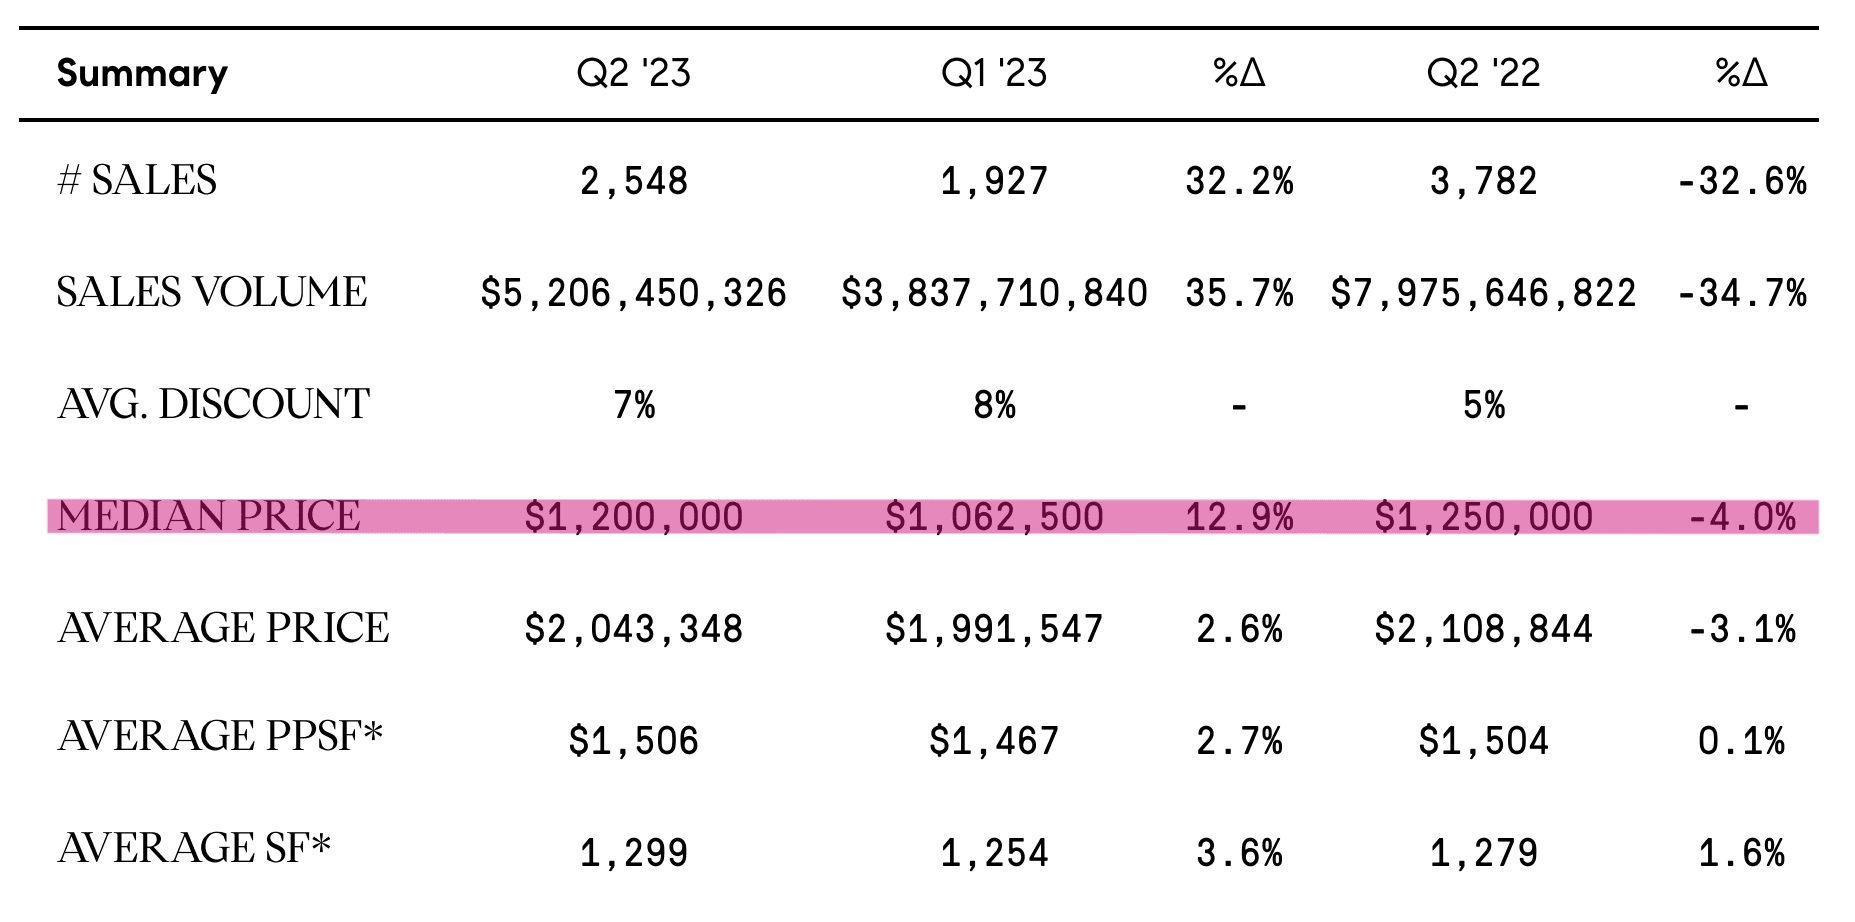
Sales volume in Q2 declined 32.6% compared to last year but saw a 32.2% increase from last quarter. The Upper East Side felt the least impact, falling 24.8% in sales compared to Q2 2022.
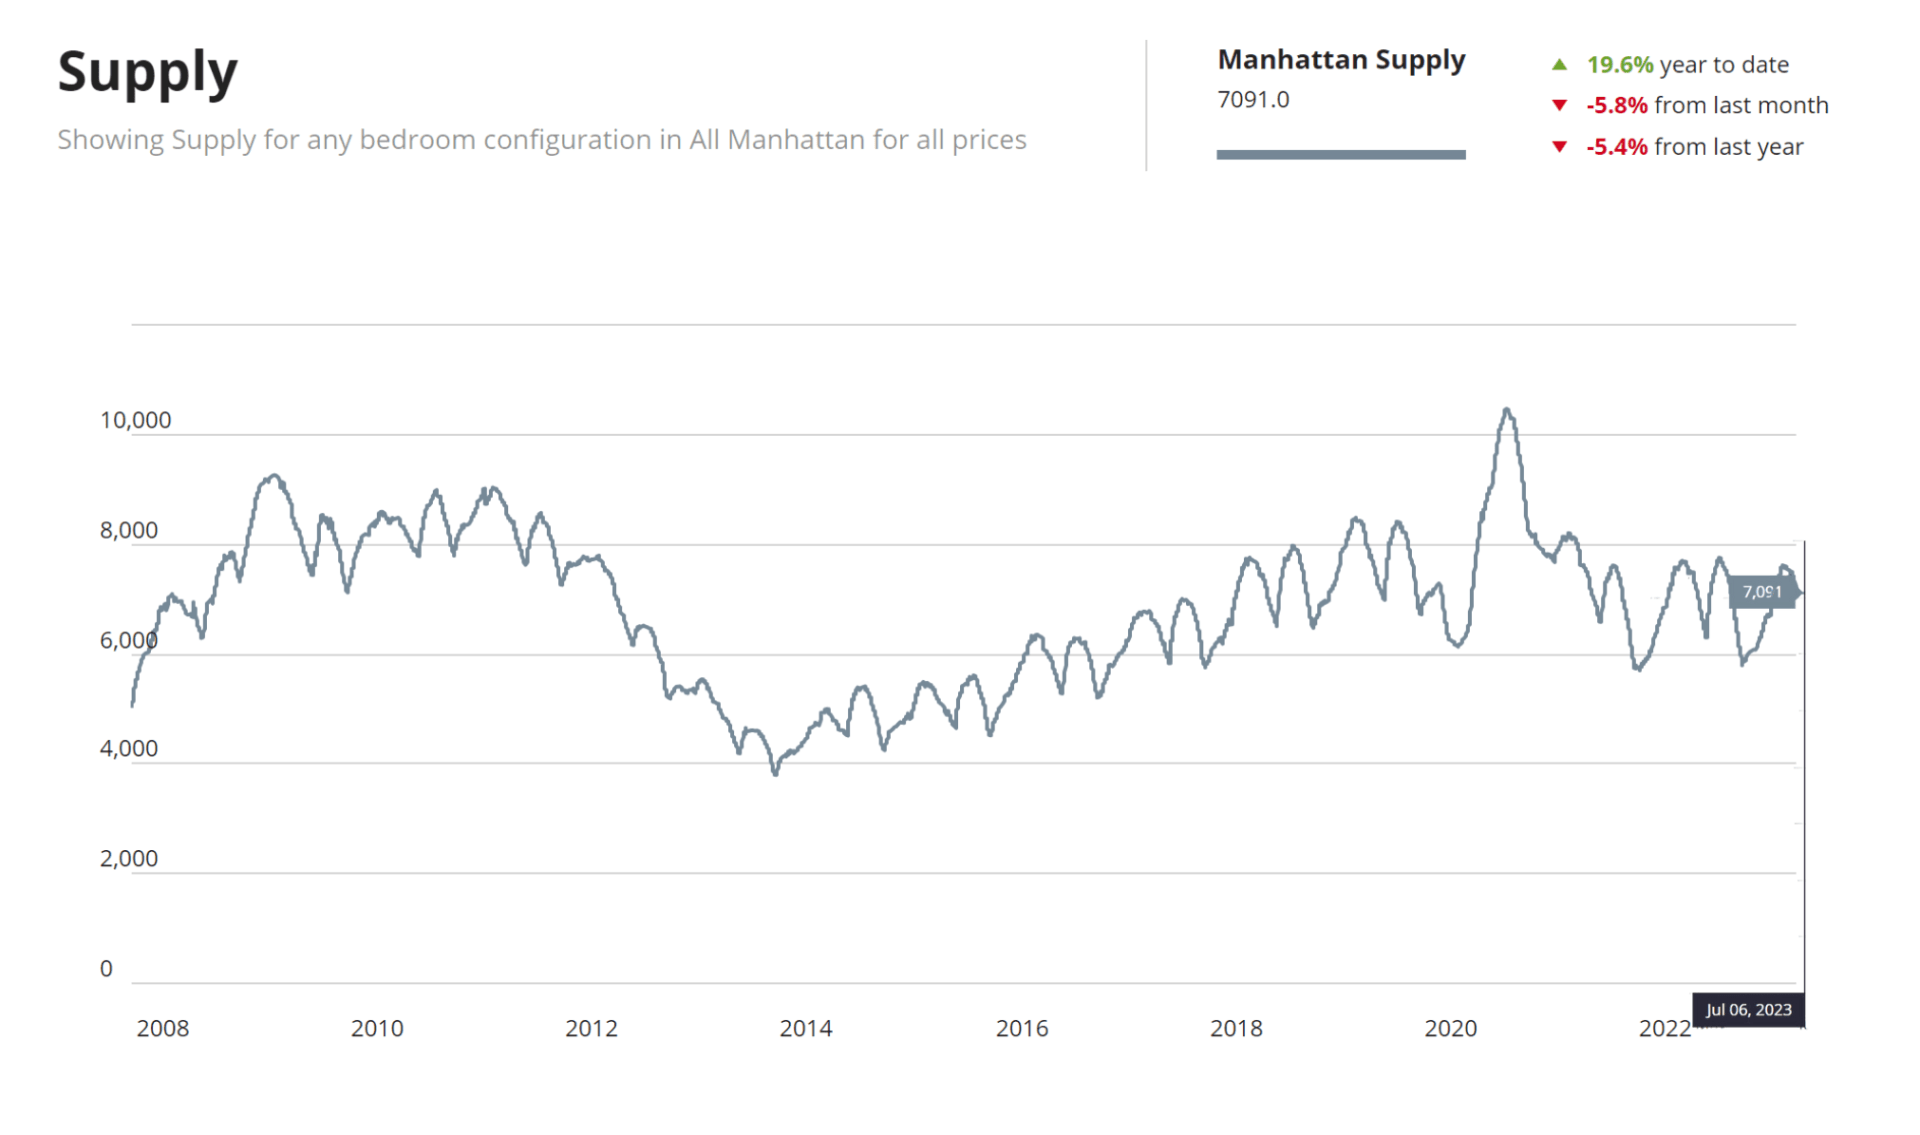
Source: UrbanDigs
Supply continues to rise and is now at 7,091 listings on the market, but it’s almost 6% lower than last month. This is most likely due to the seasonality of June, after peak supply during the spring market.
Source: Compass
The median sales price continued to rise in Q2, $1,200,000 dollars – the highest median price in history.
Source: Compass
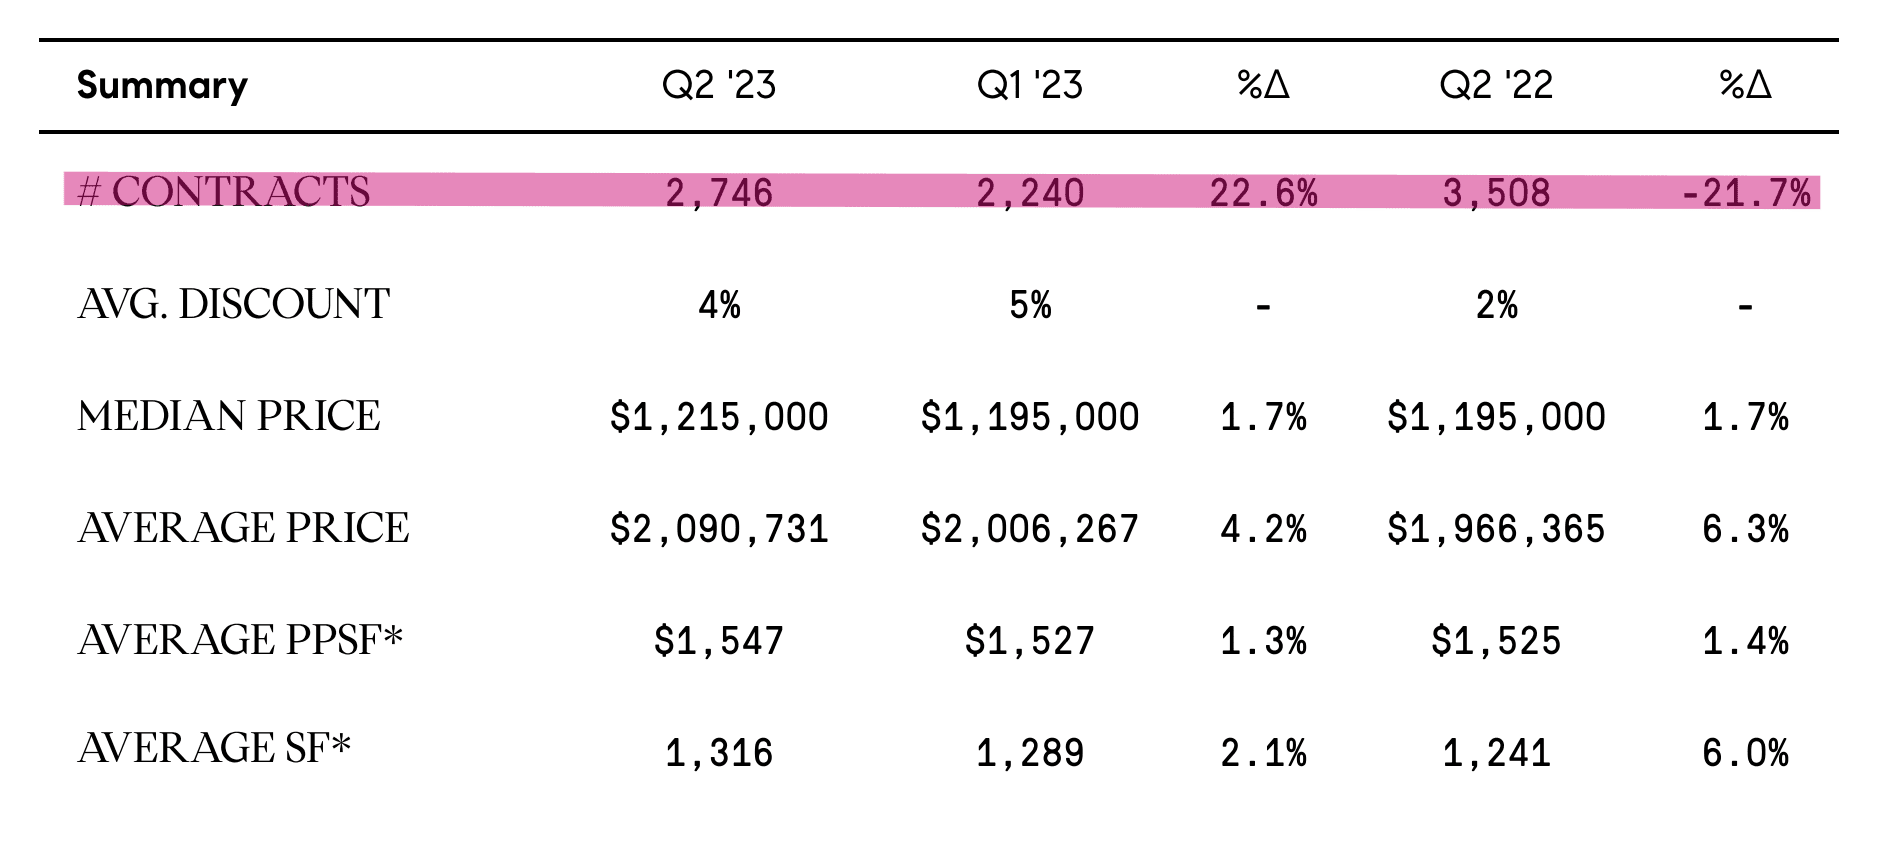
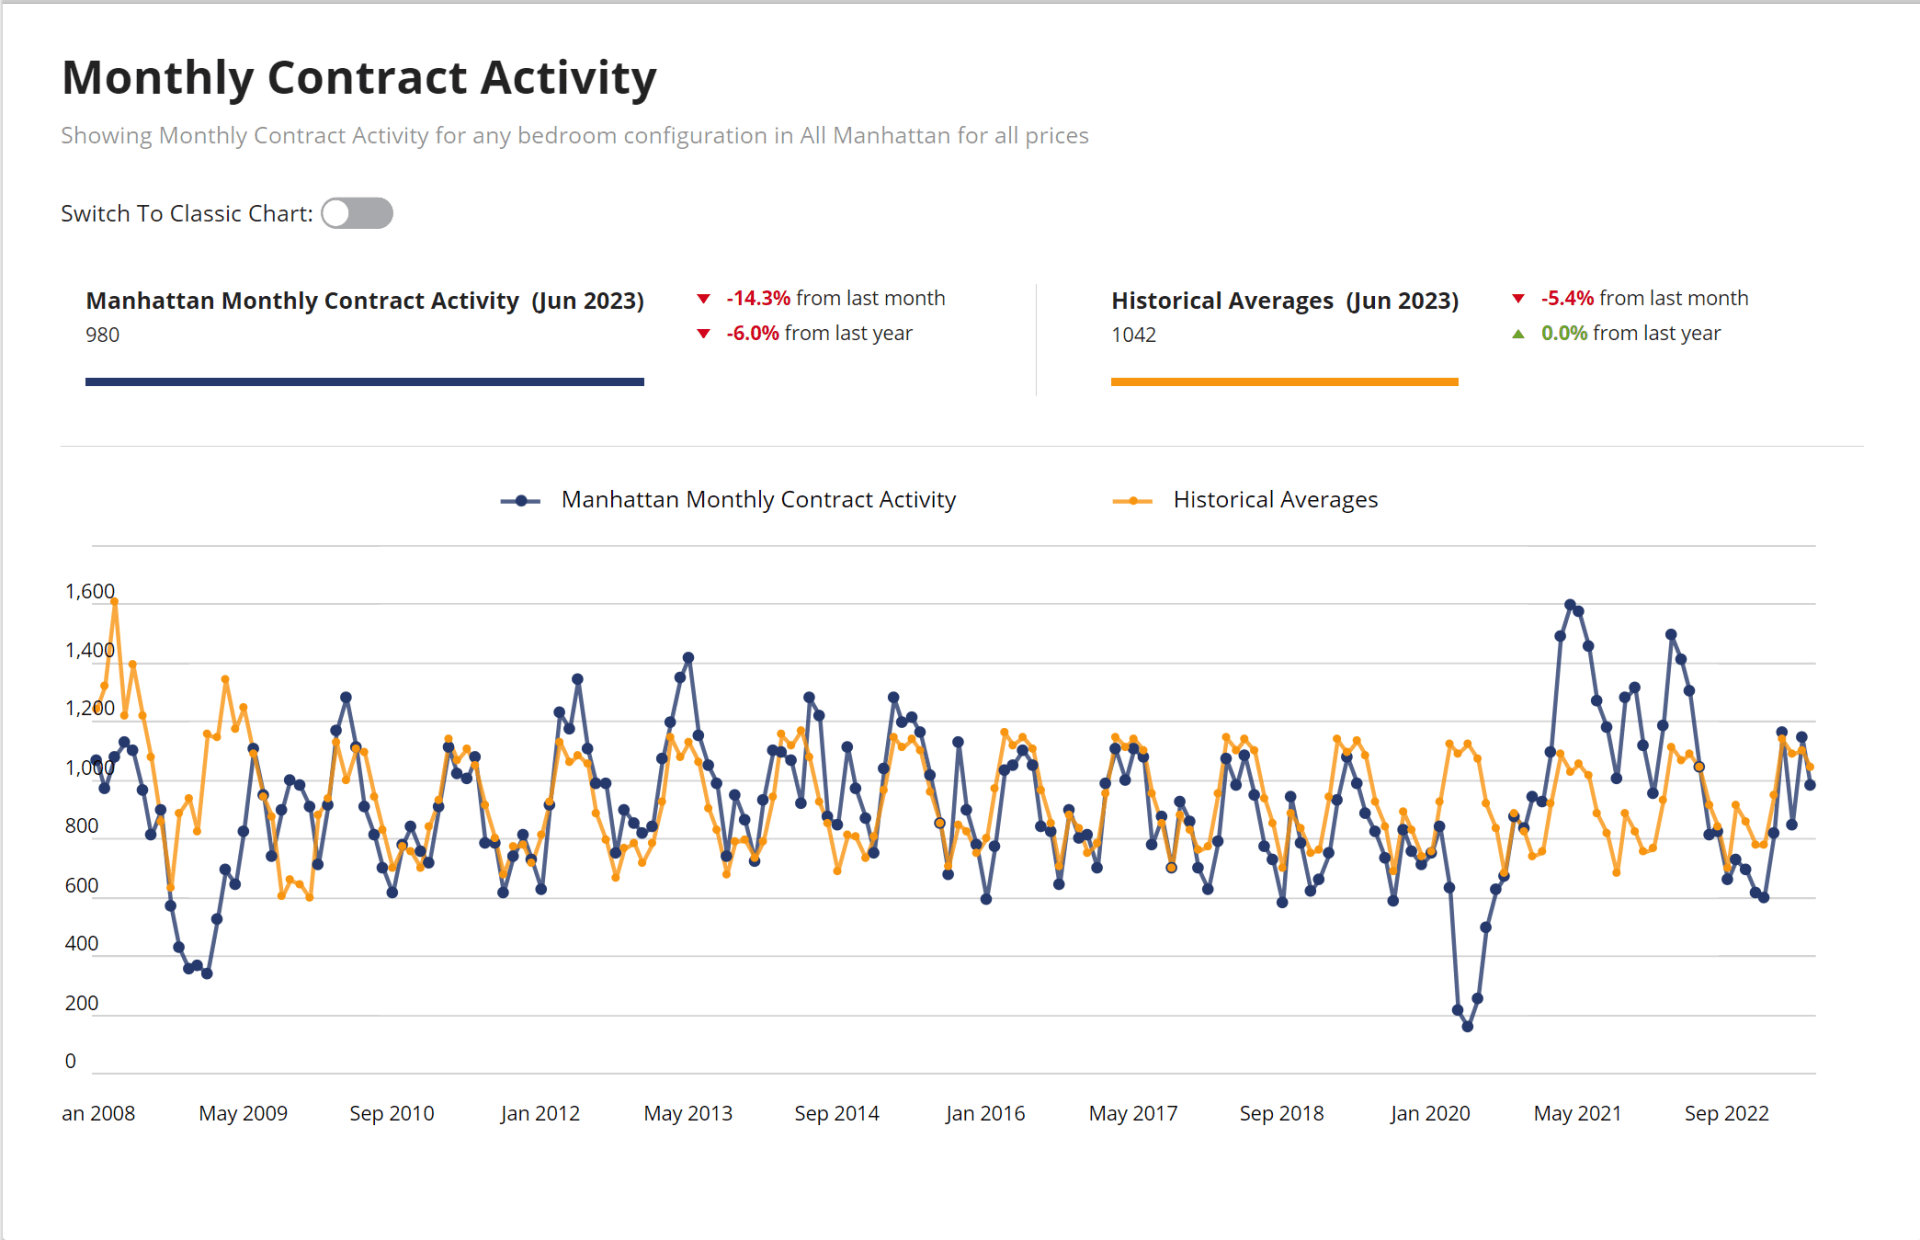
Contracts signed activity, which provides a more accurate reflection of the present market, is 21.7% down from last year, but a 22.6% increase for the quarter. For the month of June we saw a 14.3% drop from last month and now standing at 980 contracts signed - only marginally lower than the historic average.
Source: UrbanDigs
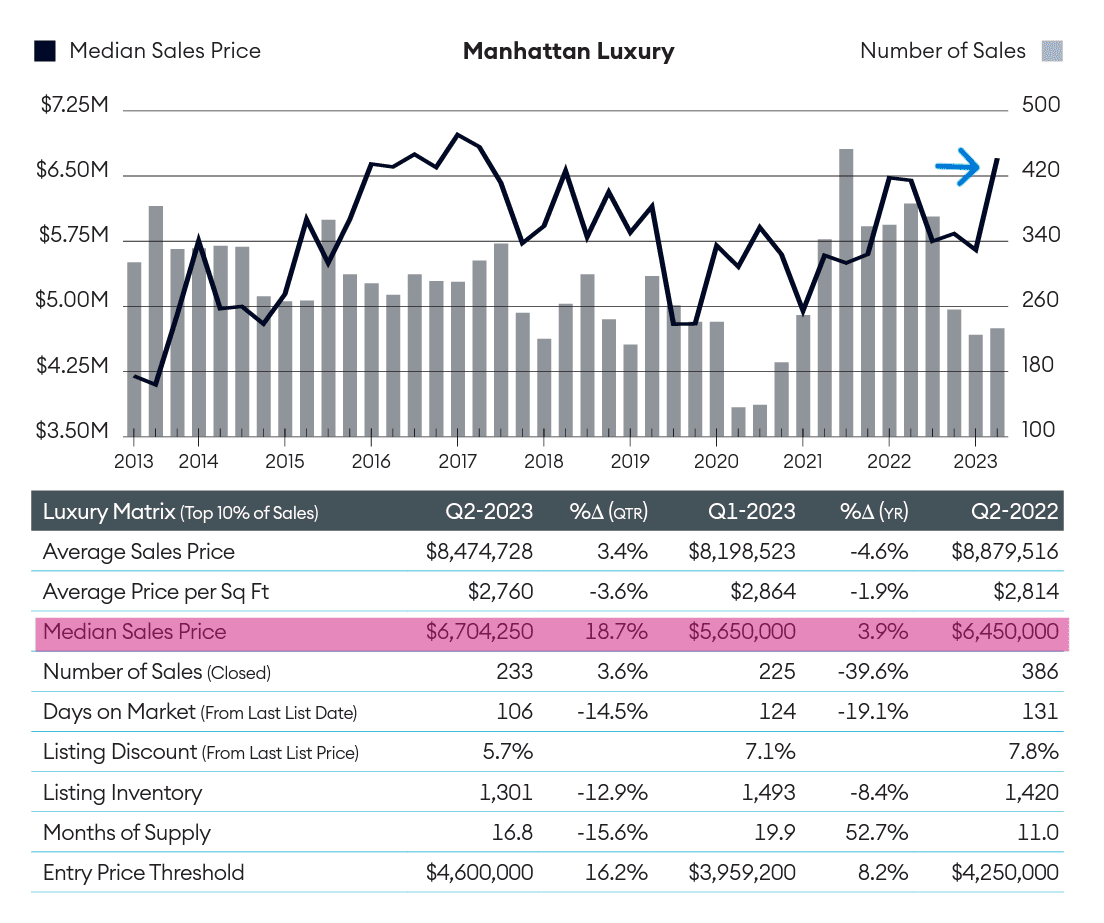
Against all expectations, the luxury market for properties priced at $5-10 million dollars saw an increase of 17.4% compared to Q2 2022, with 175 contracts signed in the second quarter. This section of the market also saw the most quarter-over-quarter growth: 6.2% of sales, the highest on record in the last 10 years. The median price for luxury properties has also continued to climb for the 5th time in 6 quarters, an 18.7% increase.
Source: Douglas Elliman
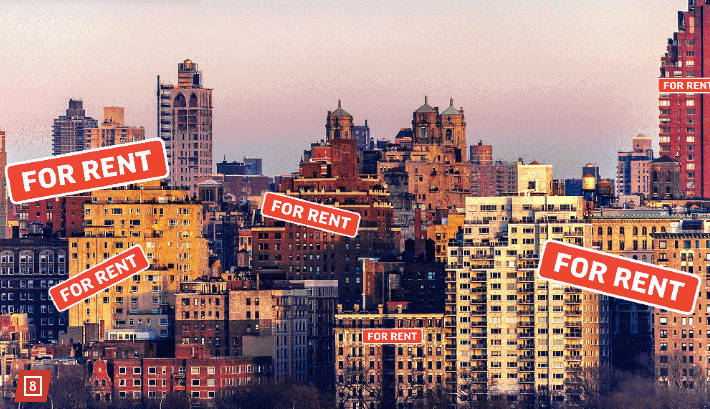
As mortgage rates continued to rise, all-cash purchases appeared to be the preferred method of payment, especially in the luxury market, where buyers with more generous liquidity regained their confidence.
Buyers looking for more attainable price points turned to the Upper East Side this past quarter, where inventory levels were relatively higher. 21.7% of all sales in Q2 were on the UES.
Source: Compass
The average listing discount dropped only slightly in Q2 to 7%. In the month of June, however, a much steeper decline – listing discount now stands at 4.8% - nearly 16% lower than last month.
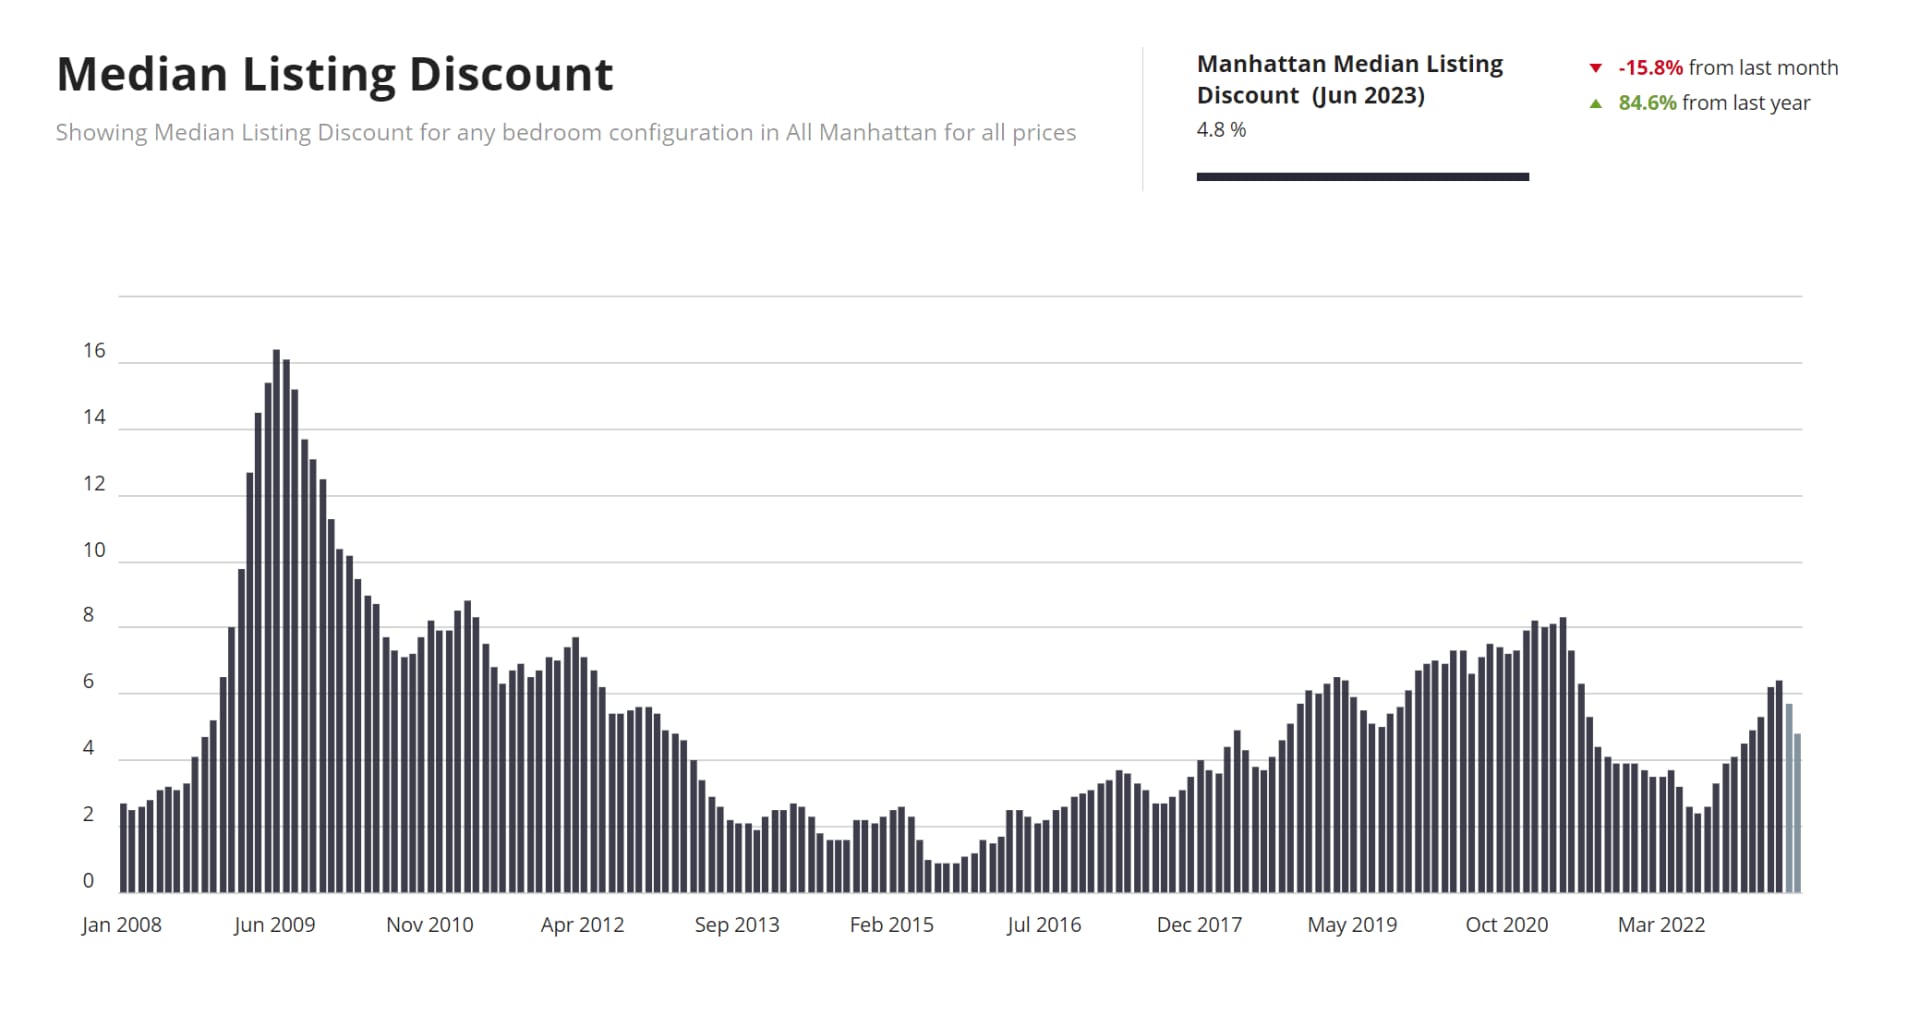
Source: UrbanDigs
The average number of days on the market continues to drop – it now takes an average of 73 days on the market to go into contract, a 13% drop from last month. This is most likely reflecting the earlier spring market, and we expect to see an increase as the market slows down for the summer.
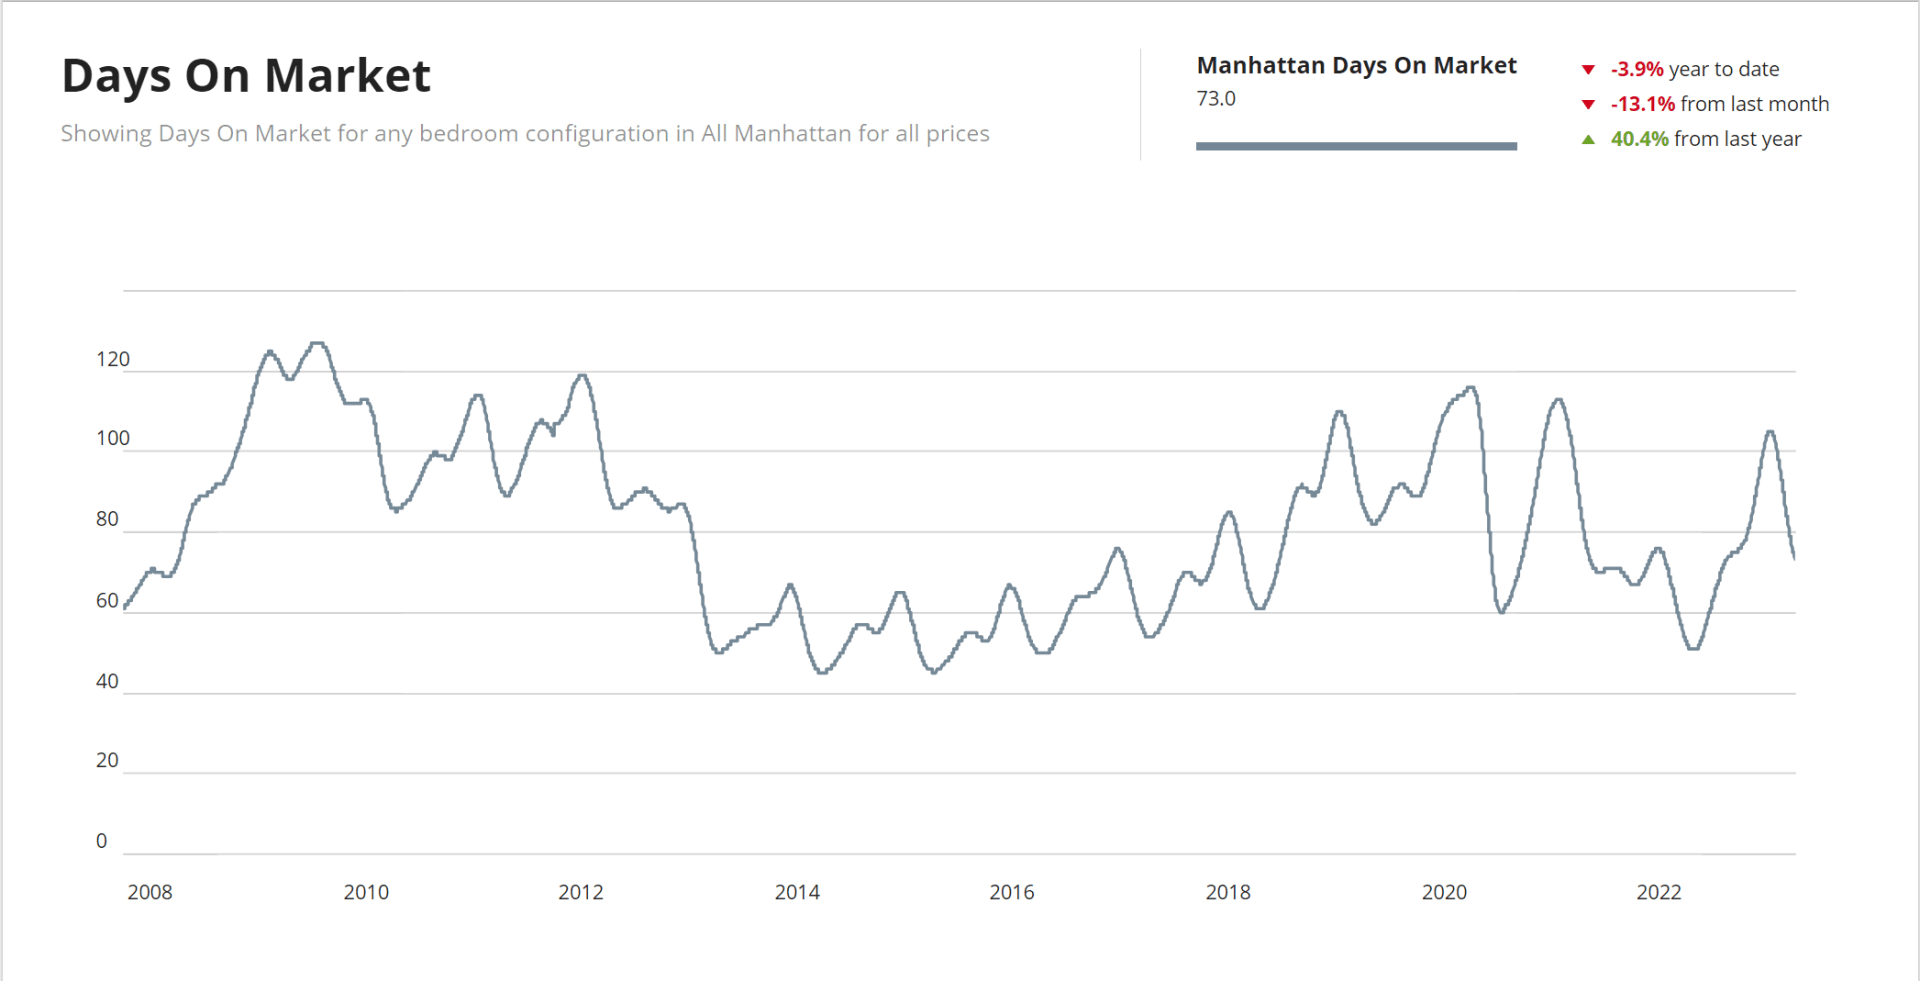
Source: UrbanDigs
Market pulse has risen 7% from last month and is now 0.46. We continue to climb out of this neutral market towards a seller’s market, as more and more buyers adjust to the higher interest rates, and – facing high rental prices - get back to the race. If this trend continues, sellers who will choose to list this summer may enjoy this advantage, which is not typical for the slower months, where buyers usually expect to cut generous deals.
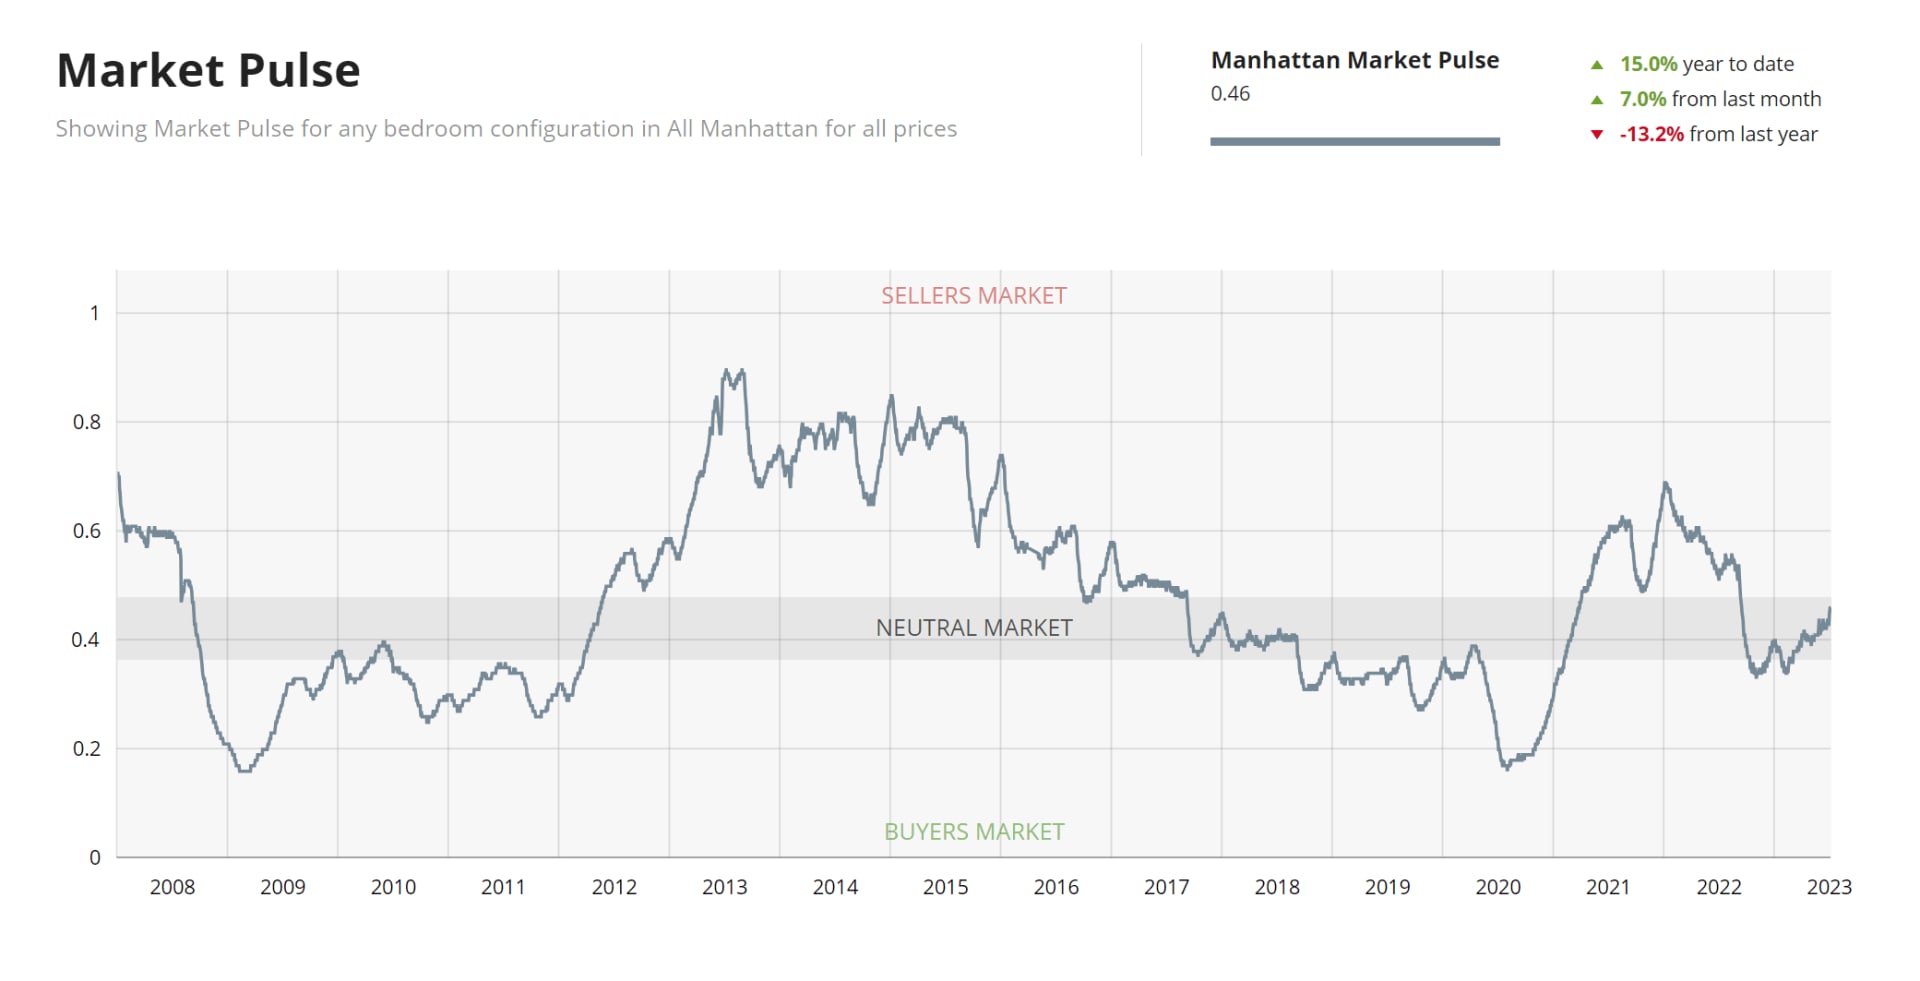
Source: UrbanDigs
Overall, we have been seeing a market adjusting to the economic climate of the past few months. Many sellers, reluctant to give up their lower mortgage rates, are staying off-market. Buyer demand also went up due to peak rental prices. The market is finally reaching the end of price distortions caused by the post-pandemic sales boom.