
Watch this content HERE
After waiting on the sidelines during the second half of 2022, buyers and sellers are back on the market, accepting the reality of higher interest rates and some uncertainties.
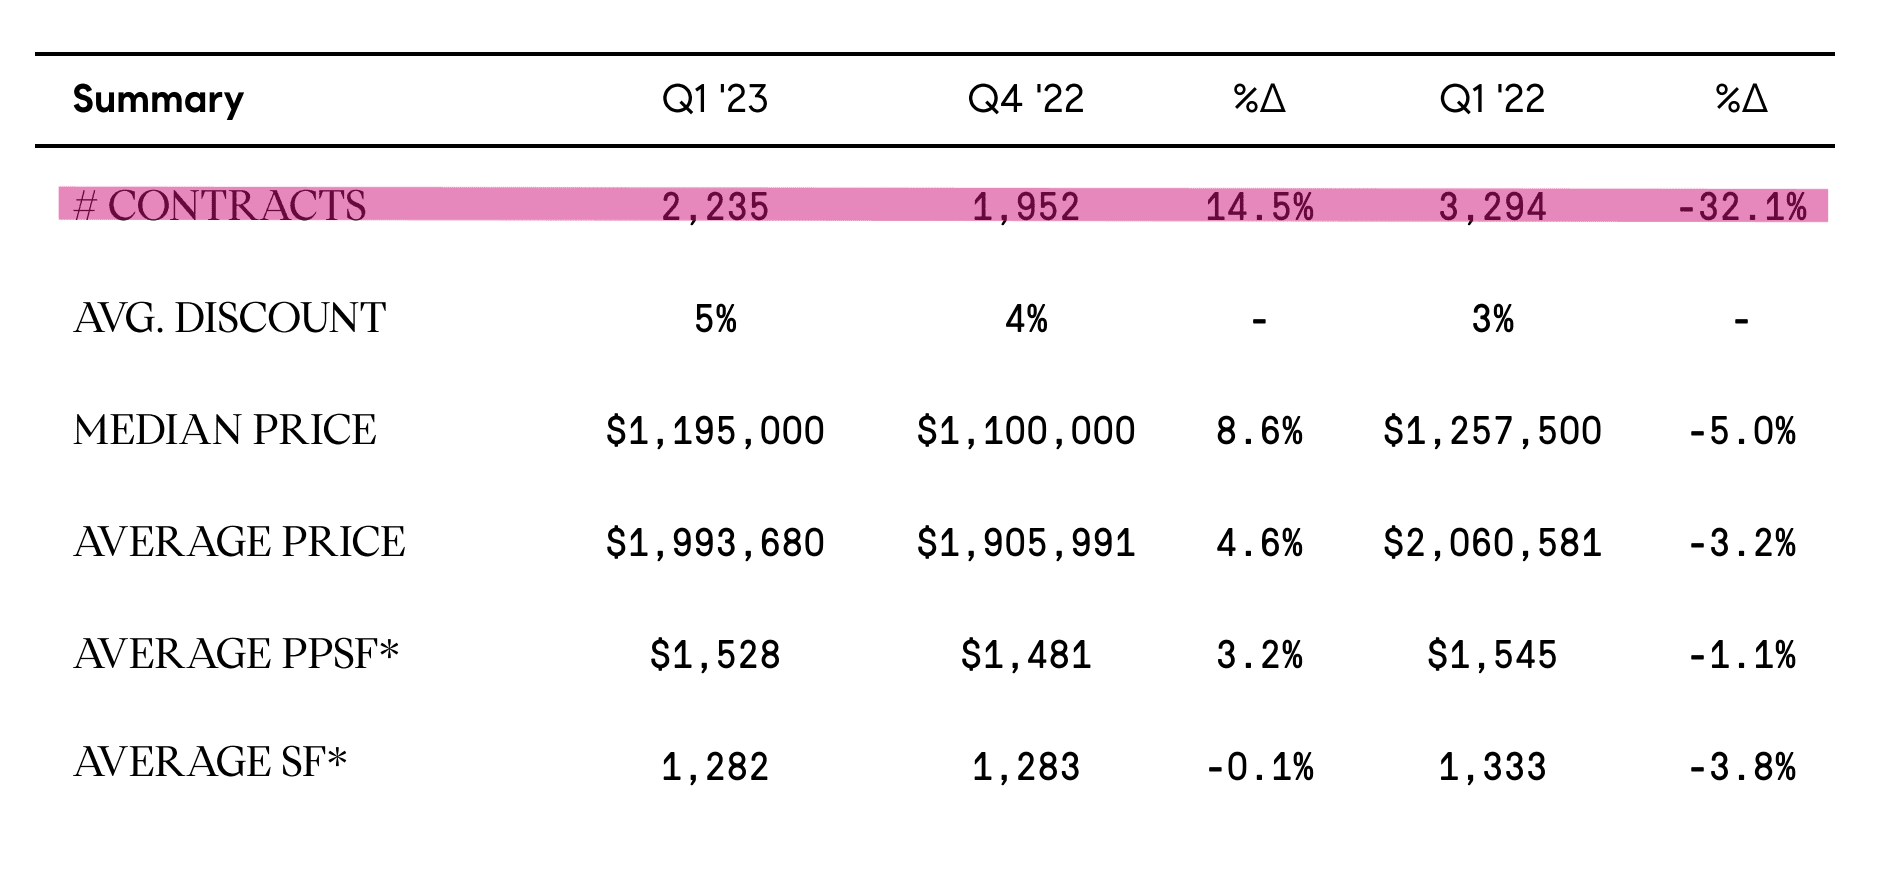
2,235 contracts were signed in the first quarter of 2023, a 14.5 percent increase from the previous quarter.
Contract signed activity for the month of March is up 20% from last month and 2.2% from last year. Signings accelerated in February and have been holding firm since. For the first time after 9 months, march’s contract-signed activity exceeded historical averages, pointing at a positive and active spring market ahead.
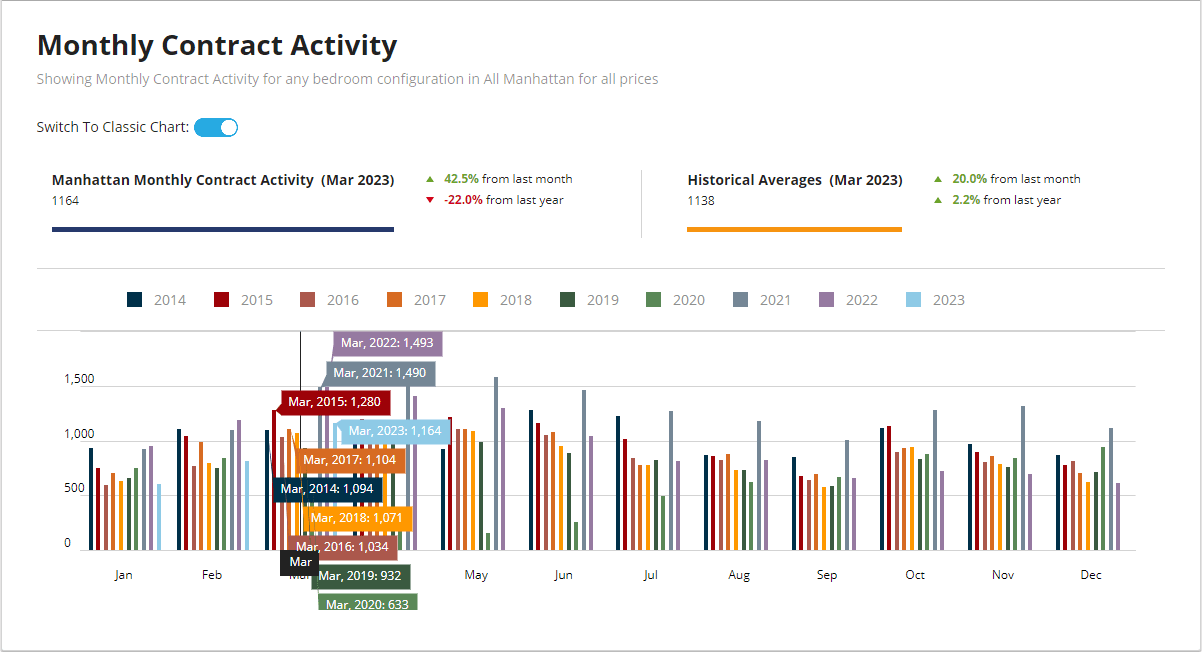
Source: UrbanDigs
2,262 apartments closed during the year's first quarter, totaling just under $4.5 billion dollars. This is a 35% decline from the same time last year, but in March, 775 transactions closed, a 14% increase from February. This transaction volume resembles the historical average a lot more than the buying frenzy that began in 2021, when interest rates were significantly lower.
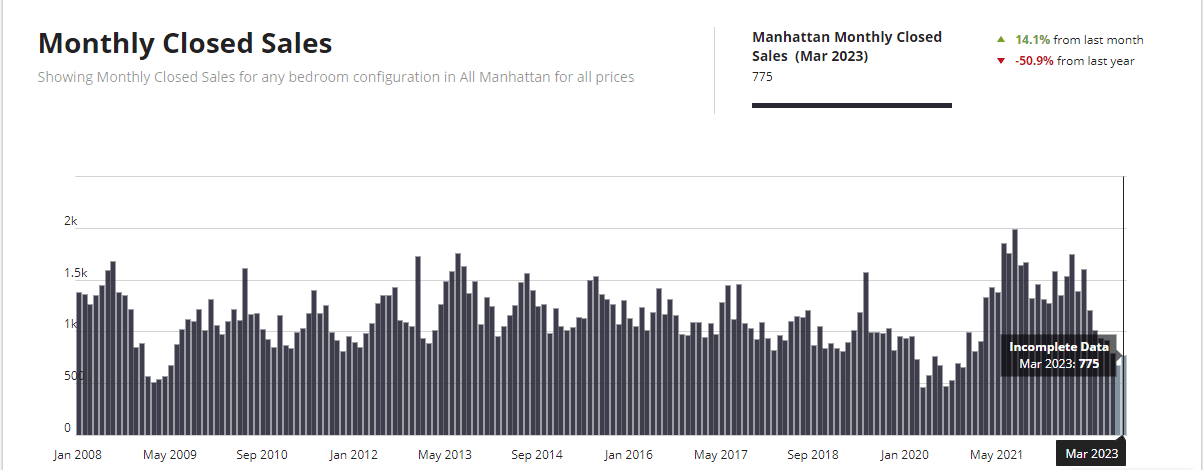
Source: UrbanDigs
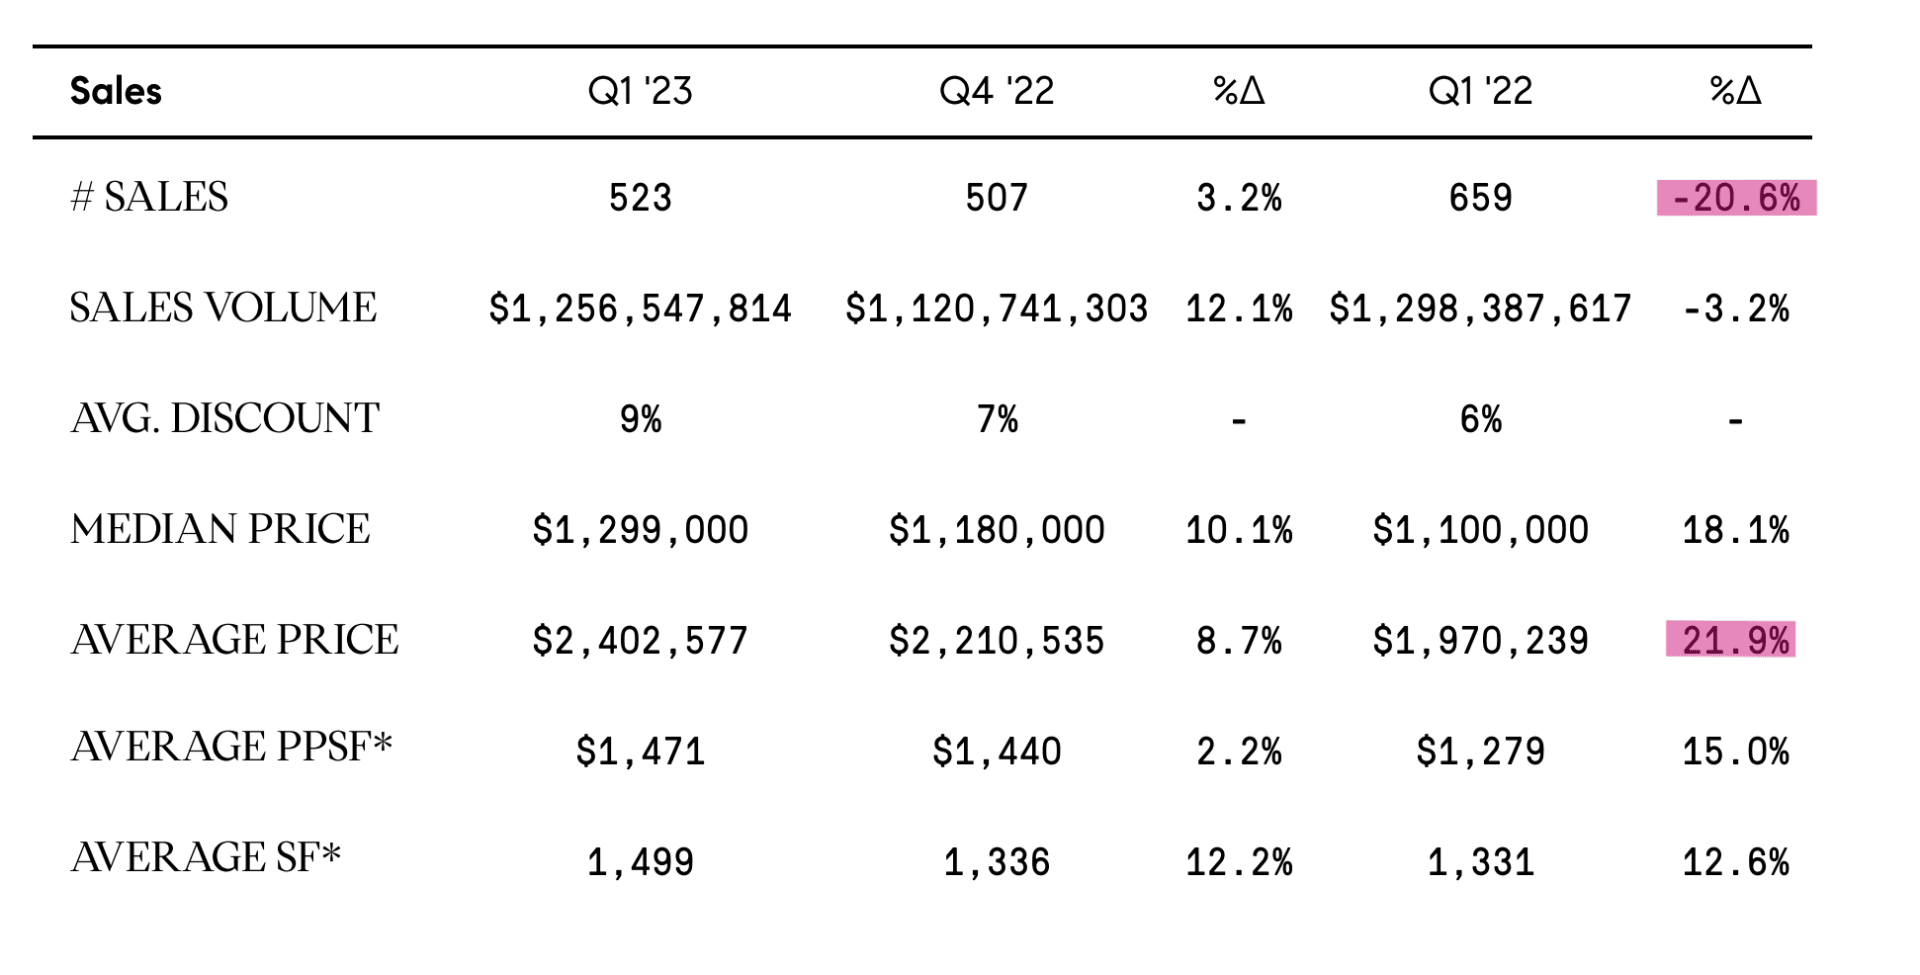
Today’s real estate market is more balanced and sustainable. Among Manhattan’s neighborhoods, the Upper Eased Side came out best, with a 20.6% decline in sales during quarter 1, but a 21.9% increase in average price, year-over-year.
Inventory climbed slightly in the first quarter of the year and continued to be around the same level of 6,000 active properties. March saw a 4.6% increase in supply from last month, and a 13% increase from last year.
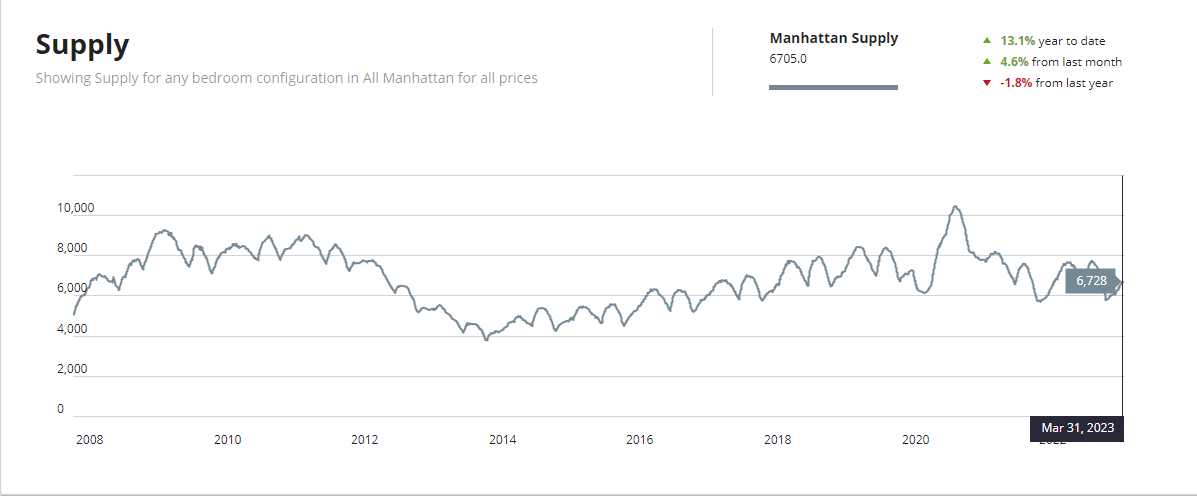
Source: UrbanDigs
Listing discount is at 7% this quarter, a one percent increase from Q4 of 2022. For the month of March however, the median discount now stands at 5.4% - a 10% increase from last month and almost 92% higher than last year!
The average days on the market is now 105, close to 40% up from last month, as well as 40% increase from last year. While that statistic might sound high, it is within seasonal trends for the month of March. If the market will continue to follow historical averages, this number will drop as we reach the summer months.
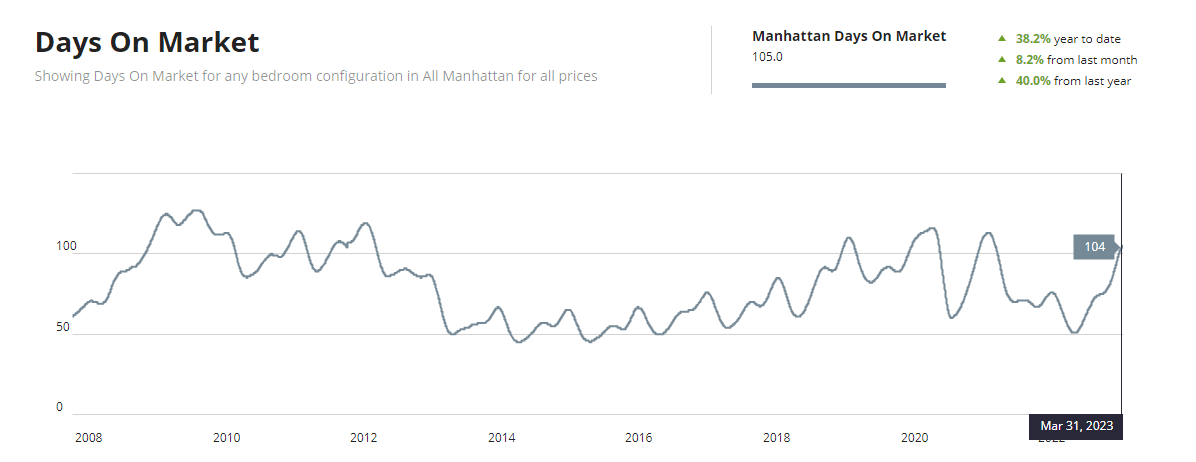
Source: UrbanDigs
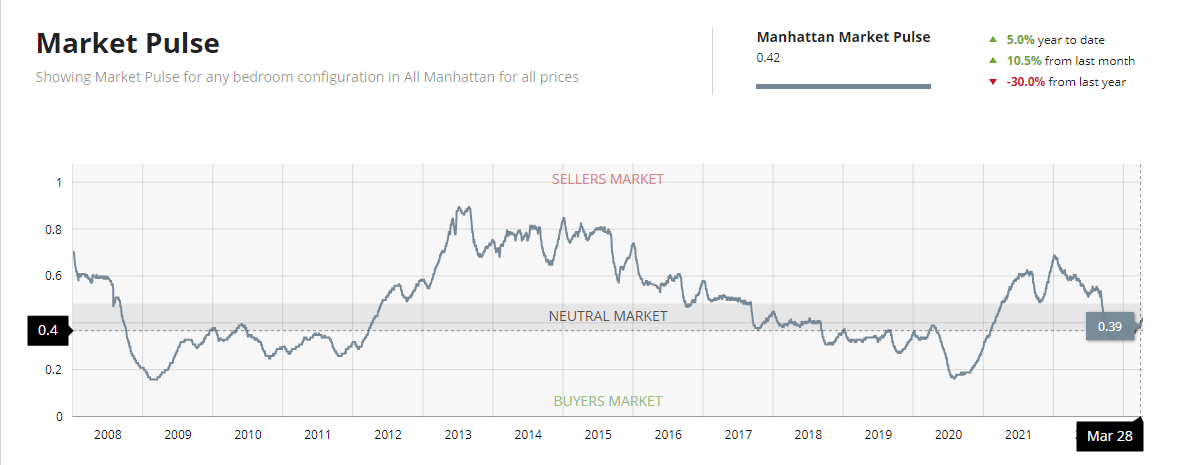
Market pulse, the ratio between pending sales and Supply, is continuing to climb and as of April 11th at 0.42 - 10.5% increase from last month but 30% lower from last year! Market pulse is rising with the number of signed contracts.
We kept saying the market would normalize, and it is indeed inching closer to historical averages. We are still in neutral territory.
Source: UrbanDigs
What do we have to look forward to?
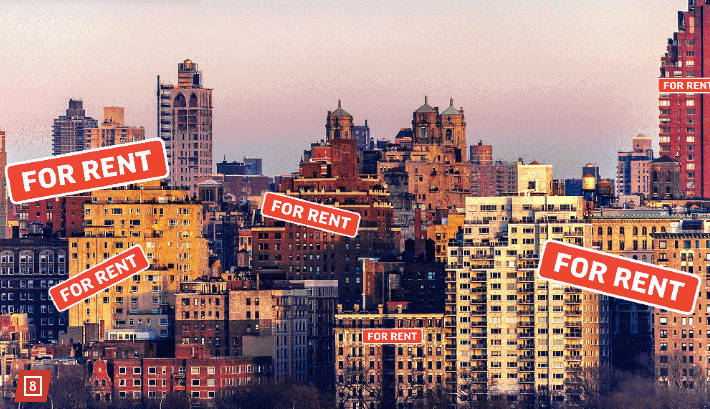
All signs point to the market continuing to evolve, with more buyers and sellers willing to transact. Seasonality, life changes, and a strong rental market have been leading causes in the rise in activity in Manhattan. Buyers and sellers should jump on this neutral market, which allows both sides to enjoy a good deal, before the summer slowdown will surely come and cool us off.